Foot Locker 2013 Annual Report Download - page 89
Download and view the complete annual report
Please find page 89 of the 2013 Foot Locker annual report below. You can navigate through the pages in the report by either clicking on the pages listed below, or by using the keyword search tool below to find specific information within the annual report.-
 1
1 -
2
-
3
-
4
-
5
-
6
-
7
-
8
-
9
-
10
-
11
-
12
-
13
-
14
-
15
-
16
-
17
-
18
-
19
-
20
-
21
-
22
-
23
-
24
-
25
-
26
-
27
-
28
-
29
-
30
-
31
-
32
-
33
-
34
-
35
-
36
-
37
-
38
-
39
-
40
-
41
-
42
-
43
-
44
-
45
-
46
-
47
-
48
-
49
-
50
-
51
-
52
-
53
-
54
-
55
-
56
-
57
-
58
-
59
-
60
-
61
-
62
-
63
-
64
-
65
-
66
-
67
-
68
-
69
-
70
-
71
-
72
-
73
-
74
-
75
-
76
-
77
-
78
-
 79
79 -
 80
80 -
 81
81 -
 82
82 -
 83
83 -
 84
84 -
 85
85 -
 86
86 -
 87
87 -
 88
88 -
 89
89 -
 90
90 -
 91
91 -
 92
92 -
 93
93 -
 94
94 -
 95
95 -
 96
96 -
 97
97 -
 98
98 -
 99
99 -
100
-
101
-
102
-
103
-
104
-
105
-
106
-
107
-
108
-
109
-
110
-
111
-
112
 |
 |
Foot Locker, Inc.
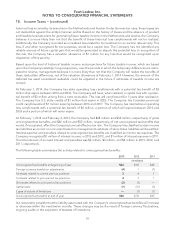
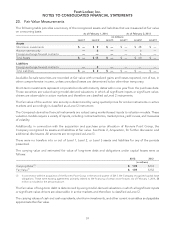
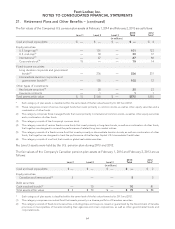
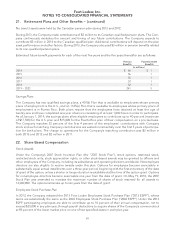
NOTES TO CONSOLIDATED FINANCIAL STATEMENTS
22. Share-Based Compensation − (continued)
Under the 2013 ESPP, 3,000,000 shares of common stock will be available for purchase beginning June 2014.
Under the 2003 ESPP, 775 participating employees purchased 133,077 shares in 2013, and 943 participating
employees purchased 218,362 shares in 2012. To date, a total of 1,629,484 shares have been purchased under
the 2003 ESPP and no further shares may be issued under this plan.
Share-Based Compensation Expense
Total compensation expense related to the Company’s share-based compensation plans was $25 million, $20
million, and $18 million for 2013, 2012, and 2011, respectively. The associated tax benefits recognized for 2013,
2012, and 2011 were $8 million, $6 million, and $6 million, respectively. Tax deductions in excess of the cumula-
tive compensation cost recognized for share-based compensation arrangements were $9 million, $11 million,
and $5 million for 2013, 2012, and 2011, respectively, and are classified as financing activities within the Consoli-
dated Statements of Cash Flows.
Valuation Model and Assumptions
The Company uses a Black-Scholes option-pricing model to estimate the fair value of share-based awards. The
Black-Scholes option-pricing model incorporates various and highly subjective assumptions, including
expected term and expected volatility.
The Company estimates the expected term of share-based awards granted using the Company’s historical
exercise and post-vesting employment termination patterns, which it believes are representative of future
behavior. The expected term for the employee stock purchase plan valuation is based on the length of each
purchase period as measured at the beginning of the offering period, which is one year.
The Company estimates the expected volatility of its common stock at the grant date using a weighted-av-
erage of the Company’s historical volatility and implied volatility from traded options on the Company’s
common stock. The Company believes that the combination of historical volatility and implied volatility pro-
vides a better estimate of future stock price volatility.
The risk-free interest rate assumption is determined using the Federal Reserve nominal rates for U.S. Treasury
zero-coupon bonds with maturities similar to those of the expected term of the award being valued. The
expected dividend yield is derived from the Company’s historical experience.
The Company records stock-based compensation expense only for those awards expected to vest using an
estimated forfeiture rate based on its historical pre-vesting forfeiture data. The Company estimates pre-vesting
option forfeitures at the time of grant and periodically revises those estimates in subsequent periods if actual
forfeitures differ from those estimates.
The following table shows the Company’s assumptions used to compute the share-based compensation
expense:
Stock Option Plans Stock Purchase Plan
2013 2012 2011 2013 2012 2011
Weighted-average risk free rate of
interest 1.02% 1.49% 2.07% 0.17% 0.22% 0.31%
Expected volatility 42% 43% 45% 40% 38% 37%
Weighted-average expected award
life
(in years) 6.0 5.5 5.0 1.0 1.0 1.0
Dividend yield 2.3% 2.3% 3.5% 2.3% 2.5% 3.4%
Weighted-average fair value $ 10.98 $ 10.13 $ 5.86 $ 5.79 $ 6.11 $ 3.91
66