Foot Locker 2013 Annual Report Download - page 42
Download and view the complete annual report
Please find page 42 of the 2013 Foot Locker annual report below. You can navigate through the pages in the report by either clicking on the pages listed below, or by using the keyword search tool below to find specific information within the annual report.-
 1
1 -
2
-
3
-
4
-
5
-
6
-
7
-
8
-
9
-
10
-
11
-
12
-
13
-
14
-
15
-
16
-
17
-
18
-
19
-
20
-
21
-
22
-
23
-
24
-
25
-
26
-
27
-
28
-
29
-
30
-
31
-
 32
32 -
 33
33 -
 34
34 -
 35
35 -
 36
36 -
 37
37 -
 38
38 -
 39
39 -
 40
40 -
 41
41 -
 42
42 -
 43
43 -
 44
44 -
 45
45 -
 46
46 -
 47
47 -
 48
48 -
 49
49 -
 50
50 -
 51
51 -
 52
52 -
53
-
54
-
55
-
56
-
57
-
58
-
59
-
60
-
61
-
62
-
63
-
64
-
65
-
66
-
67
-
68
-
69
-
70
-
71
-
72
-
73
-
74
-
75
-
76
-
77
-
78
-
79
-
80
-
81
-
82
-
83
-
84
-
85
-
86
-
87
-
88
-
89
-
90
-
91
-
92
-
93
-
94
-
95
-
96
-
97
-
98
-
99
-
100
-
101
-
102
-
103
-
104
-
105
-
106
-
107
-
108
-
109
-
110
-
111
-
112
 |
 |

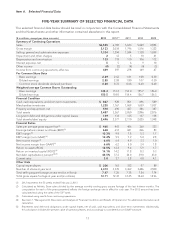
Summary of Consolidated Statement of Operations
2013 2012 2011
(in millions, except per share data)
Sales $6,505 $6,182 $5,623
Gross margin 2,133 2,034 1,796
Selling, general and administrative expenses 1,334 1,294 1,244
Depreciation and amortization 133 118 110
Interest expense, net 556
Net income $ 429 $ 397 $ 278
Diluted earnings per share $ 2.85 $ 2.58 $ 1.80
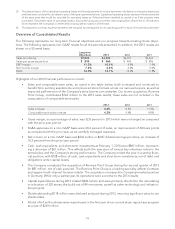
Sales
All references to comparable-store sales for a given period relate to sales of stores that are open at the period-
end and have been open for more than one year. The computation of comparable-store sales also includes the
sales of the Direct-to-Customers segment. Stores opened or closed during the period are not included in the
comparable-store base; however, stores closed temporarily for relocation or remodeling are included. Compu-
tations exclude the effects of foreign currency fluctuations.
Sales from acquired businesses that include inventory are included in the computation of comparable-store
sales after 15 months of operations. Accordingly, sales of Runners Point Group have been excluded from the
computation of comparable-store sales. Runners Point Group sales will be included in the computation begin-
ning in October 2014.
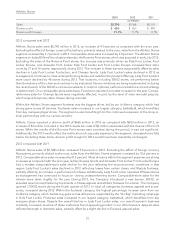
Sales of $6,505 million in 2013 increased by 5.2 percent from sales of $6,182 million in 2012, this represented a
comparable-store sales increase of 4.2 percent. Excluding the effect of foreign currency fluctuations and sales
of Runners Point Group, sales increased 2.4 percent as compared with the 53 weeks of 2012. Results for 2012
include the effect of the 53
rd
week, which represented sales of $81 million. Overall in 2013, footwear sales and
apparel and accessories sales represented 77 percent and 23 percent of total sales, respectively.
Sales in 2012 increased to $6,182 million, or by 9.9 percent as compared with 2011. Excluding the effect of
foreign currency fluctuations, sales increased 11.4 percent as compared with 2011. Comparable-store sales
increased by 9.4 percent. This increase primarily reflected higher footwear sales, which represented approxi-
mately 76 percent of sales. Apparel and accessories sales, also increased during 2012 and represented 24
percent of total sales.
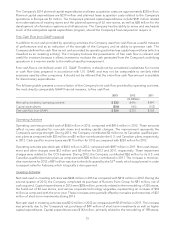
Gross Margin
2013 2012 2011
Gross margin rate 32.8% 32.9% 31.9%
Gross margin as a percentage of sales was 32.8 percent in 2013, representing a decrease of 10 basis points as
compared with the prior year. The decrease in the gross margin rate included an increase in the cost of mer-
chandise of 10 basis points. Occupancy and buyers’ compensation expense rate remained unchanged, as a
percentage of sales, as compared with the 53 weeks of 2012. The decline in the merchandise margin rate
primarily reflects the effect of lower initial markups. Vendor allowances had no effect on the gross margin rate,
as compared with the prior year. Excluding the effect of the 53
rd
week in 2012, the gross margin rate was flat as
compared with the prior year.
Gross margin as a percentage of sales was 32.9 percent in 2012, representing an increase of 100 basis points as
compared with the prior year. The increase in the gross margin rate included a decrease of 110 basis points in
the occupancy and buyers’ compensation expense rate reflecting improved leverage on largely fixed costs,
offset by an increase in the cost of merchandise of 10 basis points. The decline in the merchandise margin rate
primarily reflected the effect of lower initial markups, higher markdowns in Europe, and the effect of lower
shipping and handling income. The markdowns in Europe were necessary to ensure that merchandise invento-
ries remained current and in line with sales trend. The Direct-to-Customers segment continued to provide free
19