Foot Locker 2013 Annual Report Download - page 70
Download and view the complete annual report
Please find page 70 of the 2013 Foot Locker annual report below. You can navigate through the pages in the report by either clicking on the pages listed below, or by using the keyword search tool below to find specific information within the annual report.-
 1
1 -
2
-
3
-
4
-
5
-
6
-
7
-
8
-
9
-
10
-
11
-
12
-
13
-
14
-
15
-
16
-
17
-
18
-
19
-
20
-
21
-
22
-
23
-
24
-
25
-
26
-
27
-
28
-
29
-
30
-
31
-
32
-
33
-
34
-
35
-
36
-
37
-
38
-
39
-
40
-
41
-
42
-
43
-
44
-
45
-
46
-
47
-
48
-
49
-
50
-
51
-
52
-
53
-
54
-
55
-
56
-
57
-
58
-
59
-
 60
60 -
 61
61 -
 62
62 -
 63
63 -
 64
64 -
 65
65 -
 66
66 -
 67
67 -
 68
68 -
 69
69 -
 70
70 -
 71
71 -
 72
72 -
 73
73 -
 74
74 -
 75
75 -
 76
76 -
 77
77 -
 78
78 -
 79
79 -
 80
80 -
81
-
82
-
83
-
84
-
85
-
86
-
87
-
88
-
89
-
90
-
91
-
92
-
93
-
94
-
95
-
96
-
97
-
98
-
99
-
100
-
101
-
102
-
103
-
104
-
105
-
106
-
107
-
108
-
109
-
110
-
111
-
112
 |
 |

Foot Locker, Inc.
NOTES TO CONSOLIDATED FINANCIAL STATEMENTS
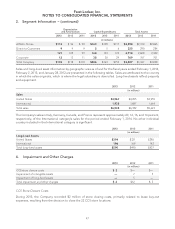
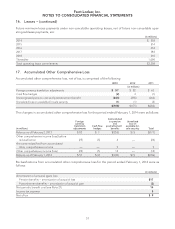
3. Segment Information − (continued)
Depreciation
and Amortization Capital Expenditures Total Assets
2013 2012 2011 2013 2012 2011 2013 2012 2011
(in millions)
Athletic Stores $112 $96 $90 $163 $128 $117 $2,398 $2,310 $2,065
Direct-to-Customers 999556320 290 284
121 105 99 168 133 123 2,718 2,600 2,349
Corporate 12 13 11 38 30 29 769 767 701
Total Company $133 $118 $110 $206 $163 $152 $3,487 $3,367 $3,050
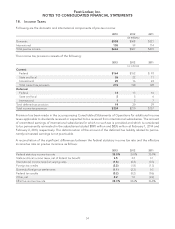
Sales and long-lived asset information by geographic area as of and for the fiscal years ended February 1, 2014,
February 2, 2013, and January 28, 2012 are presented in the following tables. Sales are attributed to the country
in which the sales originate, which is where the legal subsidiary is domiciled. Long-lived assets reflect property
and equipment.
2013 2012 2011
(in millions)
Sales
United States $4,567 $4,495 $3,959
International 1,938 1,687 1,664
Total sales $6,505 $6,182 $5,623
The Company’s sales in Italy, Germany, Canada, and France represent approximately 20, 16, 16, and 14 percent,
respectively, of the International category’s sales for the period ended February 1, 2014. No other individual
country included in the International category is significant.
2013 2012 2011
(in millions)
Long-Lived Assets
United States $394 $321 $285
International 196 169 142
Total long-lived assets $590 $490 $427
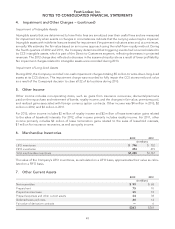
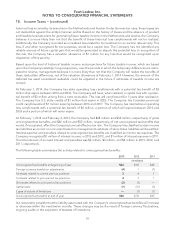
4. Impairment and Other Charges
2013 2012 2011
(in millions)
CCS store closure costs $2 $— $—
Impairment of intangible assets —75
Impairment of long-lived assets —5—
Total impairment and other charges $2 $12 $ 5
CCS Store Closure Costs
During 2013, the Company recorded $2 million of store closing costs, primarily related to lease buy-out
expenses, resulting from the decision to close the 22 CCS store locations.
47