Foot Locker 2013 Annual Report Download - page 85
Download and view the complete annual report
Please find page 85 of the 2013 Foot Locker annual report below. You can navigate through the pages in the report by either clicking on the pages listed below, or by using the keyword search tool below to find specific information within the annual report.-
 1
1 -
2
-
3
-
4
-
5
-
6
-
7
-
8
-
9
-
10
-
11
-
12
-
13
-
14
-
15
-
16
-
17
-
18
-
19
-
20
-
21
-
22
-
23
-
24
-
25
-
26
-
27
-
28
-
29
-
30
-
31
-
32
-
33
-
34
-
35
-
36
-
37
-
38
-
39
-
40
-
41
-
42
-
43
-
44
-
45
-
46
-
47
-
48
-
49
-
50
-
51
-
52
-
53
-
54
-
55
-
56
-
57
-
58
-
59
-
60
-
61
-
62
-
63
-
64
-
65
-
66
-
67
-
68
-
69
-
70
-
71
-
72
-
73
-
74
-
 75
75 -
 76
76 -
 77
77 -
 78
78 -
 79
79 -
 80
80 -
 81
81 -
 82
82 -
 83
83 -
 84
84 -
 85
85 -
 86
86 -
 87
87 -
 88
88 -
 89
89 -
 90
90 -
 91
91 -
 92
92 -
 93
93 -
 94
94 -
 95
95 -
96
-
97
-
98
-
99
-
100
-
101
-
102
-
103
-
104
-
105
-
106
-
107
-
108
-
109
-
110
-
111
-
112
 |
 |

Foot Locker, Inc.
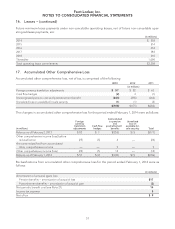
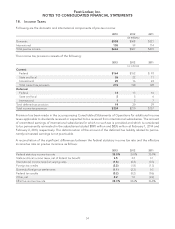
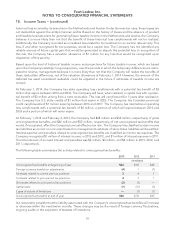
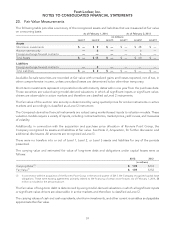
NOTES TO CONSOLIDATED FINANCIAL STATEMENTS
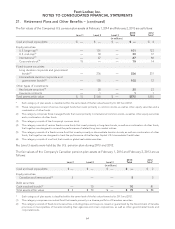
21. Retirement Plans and Other Benefits − (continued)
Assumptions used in the calculation of net benefit cost include the discount rate selected and disclosed at the
end of the previous year as well as other assumptions detailed in the table below:
Pension Benefits Postretirement Benefits
2013 2012 2011 2013 2012 2011
Discount rate 3.79% 4.16% 4.99% 3.70% 4.00% 4.60%
Rate of compensation
increase 3.69% 3.68% 3.69%
Expected long-term rate of
return on assets 6.24% 6.63% 6.59%
The expected long-term rate of return on invested plan assets is based on the plans’ weighted-average target
asset allocation, as well as historical and future expected performance of those assets. The target asset alloca-
tion is selected to obtain an investment return that is sufficient to cover the expected benefit payments and to
reduce future contributions by the Company.
The components of net benefit expense (income) are:
Pension Benefits Postretirement Benefits
2013 2012 2011 2013 2012 2011
(in millions)
Service cost $14 $13 $12 $— $— $—
Interest cost 25 28 32 1—1
Expected return on plan
assets (39) (40) (40) ———
Amortization of prior service
cost ————— (1)
Amortization of net loss (gain) 17 17 15 (3) (4) (5)
Net benefit expense (income) $17 $18 $19 $ (2) $ (4) $ (5)
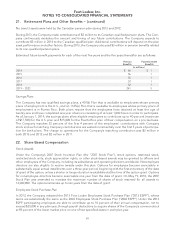
Beginning with 2001, new retirees were charged the expected full cost of the medical plan and then-existing
retirees will incur 100 percent of the expected future increases in medical plan costs. Any changes in the health
care cost trend rates assumed would not affect the accumulated benefit obligation or net benefit income, since
retirees will incur 100 percent of such expected future increase.
The Company maintains a Supplemental Executive Retirement Plan (‘‘SERP’’), which is an unfunded plan that
includes provisions for the continuation of medical and dental insurance benefits to certain executive officers
and other key employees of the Company (‘‘SERP Medical Plan’’). The SERP Medical Plan’s accumulated pro-
jected benefit obligation at February 1, 2014 was approximately $11 million.
The following initial and ultimate cost trend rate assumptions were used to determine the benefit obligations
under the SERP Medical Plan:
Medical Trend Rate Dental Trend Rate
2013 2012 2011 2013 2012 2011
Initial cost trend rate 7.00% 7.50% 8.00% 5.00% 5.00% 5.50%
Ultimate cost trend rate 5.00% 5.00% 5.00% 5.00% 5.00% 5.00%
Year that the ultimate cost trend rate
is reached 2018 2018 2018 2013 2013 2013
62