Foot Locker 2013 Annual Report Download - page 87
Download and view the complete annual report
Please find page 87 of the 2013 Foot Locker annual report below. You can navigate through the pages in the report by either clicking on the pages listed below, or by using the keyword search tool below to find specific information within the annual report.-
 1
1 -
2
-
3
-
4
-
5
-
6
-
7
-
8
-
9
-
10
-
11
-
12
-
13
-
14
-
15
-
16
-
17
-
18
-
19
-
20
-
21
-
22
-
23
-
24
-
25
-
26
-
27
-
28
-
29
-
30
-
31
-
32
-
33
-
34
-
35
-
36
-
37
-
38
-
39
-
40
-
41
-
42
-
43
-
44
-
45
-
46
-
47
-
48
-
49
-
50
-
51
-
52
-
53
-
54
-
55
-
56
-
57
-
58
-
59
-
60
-
61
-
62
-
63
-
64
-
65
-
66
-
67
-
68
-
69
-
70
-
71
-
72
-
73
-
74
-
75
-
76
-
 77
77 -
 78
78 -
 79
79 -
 80
80 -
 81
81 -
 82
82 -
 83
83 -
 84
84 -
 85
85 -
 86
86 -
 87
87 -
 88
88 -
 89
89 -
 90
90 -
 91
91 -
 92
92 -
 93
93 -
 94
94 -
 95
95 -
 96
96 -
 97
97 -
98
-
99
-
100
-
101
-
102
-
103
-
104
-
105
-
106
-
107
-
108
-
109
-
110
-
111
-
112
 |
 |

Foot Locker, Inc.
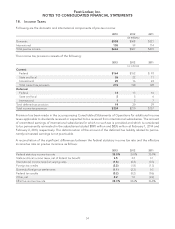
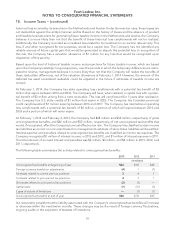
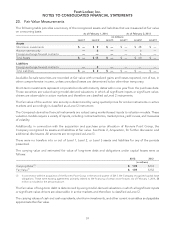
NOTES TO CONSOLIDATED FINANCIAL STATEMENTS
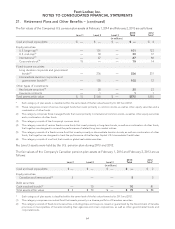
21. Retirement Plans and Other Benefits − (continued)
The fair values of the Company’s U.S. pension plan assets at February 1, 2014 and February 2, 2013 are as follows:
Level 1 Level 2 Level 3 2013
Total 2012
Total*
(in millions)
Cash and cash equivalents $ — $ — $ — $— $4
Equity securities:
U.S. large-cap
(1)
— 101 — 101 123
U.S. mid-cap
(1)
—30—30 37
International
(2)
—67—67 80
Corporate stock
(3)
15 — — 15 14
Fixed-income securities:
Long duration corporate and government
bonds
(4)
— 236 — 236 231
Intermediate duration corporate and
government bonds
(5)
— 105 — 105 72
Other types of investments:
Real estate securities
(6)
—20—20 23
Insurance contracts — 1 — 11
Total assets at fair value $ 15 $ 560 $ — $575 $585
* Each category of plan assets is classified within the same level of the fair value hierarchy for 2013 and 2012.
(1) These categories consist of various managed funds that invest primarily in common stocks, as well as other equity securities and a
combination of other funds.
(2) This category comprises three managed funds that invest primarily in international common stocks, as well as other equity securities
and a combination of other funds.
(3) This category consists of the Company’s common stock.
(4) This category consists of various fixed-income funds that invest primarily in long-term bonds, as well as a combination of other funds,
that together are designed to exceed the performance of related long-term market indices.
(5) This category consists of a fixed-income fund that invests primarily in intermediate duration bonds, as well as a combination of other
funds, that together are designed to track the performance of the Barclays Capital U.S. Intermediate Credit Index.
(6) This category consists of one fund that invests in global real estate securities.
No Level 3 assets were held by the U.S. pension plan during 2013 and 2012.
The fair values of the Company’s Canadian pension plan assets at February 1, 2014 and February 2, 2013 are as
follows:
Level 1 Level 2 Level 3 2013
Total 2012
Total*
(in millions)
Cash and cash equivalents $ — $ — $ — $— $2
Equity securities:
Canadian and international
(1)
5—— 55
Debt securities:
Cash matched bonds
(2)
—70—70 81
Total assets at fair value $ 5 $ 70 $ — $75 $88
* Each category of plan assets is classified within the same level of the fair value hierarchy for 2013 and 2012.
(1) This category comprises one mutual fund that invests primarily in a diverse portfolio of Canadian securities.
(2) This category consists of fixed-income securities, including strips and coupons, issued or guaranteed by the Government of Canada,
provinces or municipalities of Canada including their agencies and crown corporations, as well as other governmental bonds and
corporate bonds.
64