Foot Locker 2013 Annual Report Download - page 48
Download and view the complete annual report
Please find page 48 of the 2013 Foot Locker annual report below. You can navigate through the pages in the report by either clicking on the pages listed below, or by using the keyword search tool below to find specific information within the annual report.-
 1
1 -
2
-
3
-
4
-
5
-
6
-
7
-
8
-
9
-
10
-
11
-
12
-
13
-
14
-
15
-
16
-
17
-
18
-
19
-
20
-
21
-
22
-
23
-
24
-
25
-
26
-
27
-
28
-
29
-
30
-
31
-
32
-
33
-
34
-
35
-
36
-
37
-
 38
38 -
 39
39 -
 40
40 -
 41
41 -
 42
42 -
 43
43 -
 44
44 -
 45
45 -
 46
46 -
 47
47 -
 48
48 -
 49
49 -
 50
50 -
 51
51 -
 52
52 -
 53
53 -
 54
54 -
 55
55 -
 56
56 -
 57
57 -
 58
58 -
59
-
60
-
61
-
62
-
63
-
64
-
65
-
66
-
67
-
68
-
69
-
70
-
71
-
72
-
73
-
74
-
75
-
76
-
77
-
78
-
79
-
80
-
81
-
82
-
83
-
84
-
85
-
86
-
87
-
88
-
89
-
90
-
91
-
92
-
93
-
94
-
95
-
96
-
97
-
98
-
99
-
100
-
101
-
102
-
103
-
104
-
105
-
106
-
107
-
108
-
109
-
110
-
111
-
112
 |
 |

The Company’s 2014 planned capital expenditures and lease acquisition costs are approximately $220 million.
Planned capital expenditures are $219 million and planned lease acquisition costs related to the Company’s
operations in Europe are $1 million. The Company’s planned capital expenditures include $181 million related
to modernizations of existing stores and the planned opening of 62 new stores, as well as $38 million for the
development of information systems and infrastructure. The Company has the ability to revise and reschedule
much of the anticipated capital expenditure program, should the Company’s financial position require it.
Free Cash Flow (non-GAAP measure)
In addition to net cash provided by operating activities, the Company uses free cash flow as a useful measure
of performance and as an indication of the strength of the Company and its ability to generate cash. The
Company defines free cash flow as net cash provided by operating activities less capital expenditures (which is
classified as an investing activity). The Company believes the presentation of free cash flow is relevant and
useful for investors because it allows investors to evaluate the cash generated from the Company’s underlying
operations in a manner similar to the method used by management.
Free cash flow is not defined under U.S. GAAP. Therefore, it should not be considered a substitute for income
or cash flow data prepared in accordance with U.S. GAAP, and may not be comparable to similarly titled
measures used by other companies. It should not be inferred that the entire free cash flow amount is available
for discretionary expenditures.
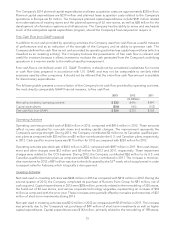
The following table presents a reconciliation of the Company’s net cash flow provided by operating activities,
the most directly comparable GAAP financial measure, to free cash flow.
2013 2012 2011
(in millions)
Net cash provided by operating activities $ 530 $ 416 $ 497
Capital expenditures (206) (163) (152)
Free cash flow (non-GAAP) $ 324 $ 253 $ 345
Operating Activities
Operating activities provided cash of $530 million in 2013, compared with $416 million in 2012. These amounts
reflect income adjusted for non-cash items and working capital changes. The improvement represents the
Company’s earnings strength. During 2013, the Company contributed $2 million to its Canadian qualified pen-
sion plans as compared with $25 million and $1 million contributed to the U.S. and Canadian plans, respectively,
in 2012. Cash paid for income taxes was $175 million for 2013 as compared with $230 million for 2012.
Operating activities provided cash of $416 million in 2012, compared with $497 million in 2011. Non-cash impair-
ment and other charges were $12 million and $5 million for 2012 and 2011, respectively. These impairment
charges were related to the CCS business. During 2012, the Company contributed $26 million to its U.S. and
Canadian qualified pension plans as compared with $28 million contributed in 2011. The increase in merchan-
dise inventories for 2012 of $91 million was due to the shift caused by the 53
rd
week, which was planned in order
to support sales for February, which is typically a strong period.
Investing Activities
Net cash used in investing activities was $248 million in 2013 as compared with $212 million in 2012. During the
second quarter of 2013, the Company completed its purchase of Runners Point Group for $81 million, net of
cash acquired. Capital expenditures in 2013 were $206 million, primarily related to the remodeling of 320 stores,
the build-out of 84 new stores, and various corporate technology upgrades, representing an increase of $43
million as compared with the prior year. These increases were partially offset by net sales and maturities of $37
million of short-term investments during 2013.
Net cash used in investing activities was $212 million in 2012 as compared with $149 million in 2011. The increase
was primarily due to the Company’s net purchases of $49 million of short-term investments as well as higher
capital expenditures. Capital expenditures were $163 million, primarily related to the remodeling of 198 stores,
25