Foot Locker 2013 Annual Report Download - page 40
Download and view the complete annual report
Please find page 40 of the 2013 Foot Locker annual report below. You can navigate through the pages in the report by either clicking on the pages listed below, or by using the keyword search tool below to find specific information within the annual report.-
 1
1 -
2
-
3
-
4
-
5
-
6
-
7
-
8
-
9
-
10
-
11
-
12
-
13
-
14
-
15
-
16
-
17
-
18
-
19
-
20
-
21
-
22
-
23
-
24
-
25
-
26
-
27
-
28
-
29
-
 30
30 -
 31
31 -
 32
32 -
 33
33 -
 34
34 -
 35
35 -
 36
36 -
 37
37 -
 38
38 -
 39
39 -
 40
40 -
 41
41 -
 42
42 -
 43
43 -
 44
44 -
 45
45 -
 46
46 -
 47
47 -
 48
48 -
 49
49 -
 50
50 -
51
-
52
-
53
-
54
-
55
-
56
-
57
-
58
-
59
-
60
-
61
-
62
-
63
-
64
-
65
-
66
-
67
-
68
-
69
-
70
-
71
-
72
-
73
-
74
-
75
-
76
-
77
-
78
-
79
-
80
-
81
-
82
-
83
-
84
-
85
-
86
-
87
-
88
-
89
-
90
-
91
-
92
-
93
-
94
-
95
-
96
-
97
-
98
-
99
-
100
-
101
-
102
-
103
-
104
-
105
-
106
-
107
-
108
-
109
-
110
-
111
-
112
 |
 |

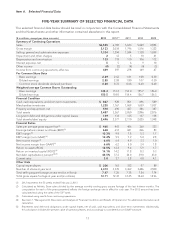
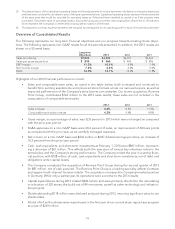
2013 2012 2011
(in millions, except per share amounts)
Net income margin % 6.6% 6.4% 4.9%
Net income margin % (non-GAAP) 6.6% 6.2% 5.0%
Diluted earnings per share:
Net income $ 2.85 $ 2.58 $1.80
Runners Point Group acquisition and integration costs 0.03 ——
Impairment and other charges 0.01 0.05 0.02
53
rd
week —(0.09) —
Settlement of foreign tax audits (0.02) (0.06) —
Canadian tax rate changes —(0.01) —
Net income (non-GAAP) $ 2.87 $ 2.47 $1.82
The Company estimates the tax effect of the non-GAAP adjustments by applying its marginal tax rate to each
of the respective items.
During 2013 and 2012, the Company recorded benefits of $3 million and $9 million, or $0.02 per diluted share
and $0.06 per diluted share, respectively, to reflect the settlement of foreign tax audits, which resulted in a
reduction in tax reserves established in prior periods. Additionally in 2012, the Company recorded a benefit of
$1 million, or $0.01 per diluted share, to reflect the repeal of the last two stages of certain Canadian provincial
tax rate changes.
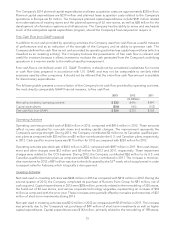
When assessing Return on Invested Capital (‘‘ROIC’’), the Company adjusts its results to reflect its operating
leases as if they qualified for capital lease treatment. Operating leases are the primary financing vehicle used
to fund store expansion and, therefore, we believe that the presentation of these leases as if they were capital
leases is appropriate. Accordingly, the asset base and net income amounts are adjusted to reflect this in the
calculation of ROIC. ROIC, subject to certain adjustments, is also used as a measure in executive long-term
incentive compensation.
The closest GAAP measure is Return on Assets (‘‘ROA’’) and is also represented below. ROA increased to
12.5 percent as compared with 12.4 percent in the prior year reflecting the Company’s overall performance in
2013. Our ROIC decreased slightly as compared with the prior year due to an increase in our average invested
capital primarily as a result of the inclusion of Runners Point Group during the second quarter of 2013. This was
partly offset by an increase in our earnings before interest and income taxes.
2013 2012 2011
ROA
(1)
12.5% 12.4% 9.4%
ROIC % (non-GAAP)
(2)
14.1% 14.2% 11.8%
(1) Represents net income of $429 million, $397 million, and $278 million divided by average total assets of $3,427 million, $3,209 million,
and $2,973 million for 2013, 2012, and 2011, respectively.
(2) See below for the calculation of ROIC.
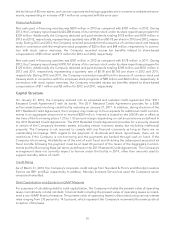
2013 2012 2011
(in millions)
EBIT (non-GAAP) $ 676 $ 602 $ 446
+ Rent expense 600 560 544
- Estimated depreciation on capitalized operating leases
(3)
(443) (409) (389)
Net operating profit 833 753 601
- Adjusted income tax expense
(4)
(298) (274) (218)
= Adjusted return after taxes $ 535 $ 479 $ 383
Average total assets $ 3,427 $ 3,209 $ 2,973
- Average cash, cash equivalents and short-term investments (898) (890) (774)
- Average non-interest bearing current liabilities (630) (592) (519)
- Average merchandise inventories (1,194) (1,118) (1,064)
+ Average estimated asset base of capitalized operating leases
(3)
1,829 1,552 1,429
+ 13-month average merchandise inventories 1,269 1,200 1,192
= Average invested capital $ 3,803 $ 3,361 $ 3,237
ROIC % 14.1% 14.2% 11.8%
17