Foot Locker 2013 Annual Report Download - page 7
Download and view the complete annual report
Please find page 7 of the 2013 Foot Locker annual report below. You can navigate through the pages in the report by either clicking on the pages listed below, or by using the keyword search tool below to find specific information within the annual report.-
 1
1 -
 2
2 -
 3
3 -
 4
4 -
 5
5 -
 6
6 -
 7
7 -
 8
8 -
 9
9 -
 10
10 -
 11
11 -
 12
12 -
 13
13 -
 14
14 -
 15
15 -
 16
16 -
 17
17 -
 18
18 -
19
-
20
-
21
-
22
-
23
-
24
-
25
-
26
-
27
-
28
-
29
-
30
-
31
-
32
-
33
-
34
-
35
-
36
-
37
-
38
-
39
-
40
-
41
-
42
-
43
-
44
-
45
-
46
-
47
-
48
-
49
-
50
-
51
-
52
-
53
-
54
-
55
-
56
-
57
-
58
-
59
-
60
-
61
-
62
-
63
-
64
-
65
-
66
-
67
-
68
-
69
-
70
-
71
-
72
-
73
-
74
-
75
-
76
-
77
-
78
-
79
-
80
-
81
-
82
-
83
-
84
-
85
-
86
-
87
-
88
-
89
-
90
-
91
-
92
-
93
-
94
-
95
-
96
-
97
-
98
-
99
-
100
-
101
-
102
-
103
-
104
-
105
-
106
-
107
-
108
-
109
-
110
-
111
-
112
 |
 |
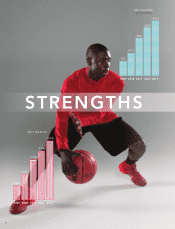
6
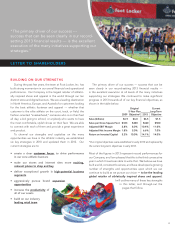
STRENGTHS
Our nancial performance has not only improved to new
heights in recent years, it has also become more consistent. Much
of this consistency stems from the various aspects of diversity in
our business that we have achieved by executing our strategies.
First, we have not only a strong men’s business, we also have
a very robust children’s business that will continue to provide
growth opportunities, and a very signicant women’s business
which we are focused on bringing up to the productivity level
of the rest of the business.
Second, we not only developed a strong basketball busi-
ness, but our running business, our casual offerings, and our
apparel assortments are also much stronger compared to
a few years ago, and give us a better merchandise balance
than before.
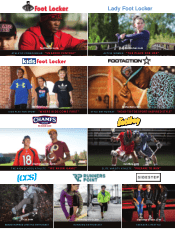
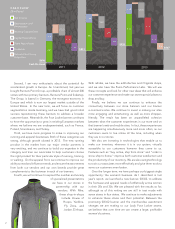
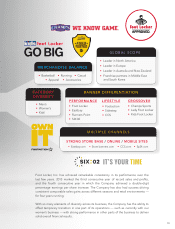
Third, we have clearly differentiated our banners, enabling
each of them to focus on a particular customer group. We
have banners, such as Foot Locker, Eastbay, Runners Point, and
SIX:02, that concentrate on high-performance footwear and
apparel, and we have banners, such as Footaction, Sidestep,
and CCS, that offer a much more lifestyle product assortment
unique to each banner. Our banner with our biggest stores,
Champs Sports, is able to serve customers effectively across
a broad athletic spectrum, while concentrating on the kid who
knows game, who lives and breathes sports. Among the many
benets of this differentiation is our ability to create truly great
marketing campaigns that draw customers to our unique store
banners and digital sites.
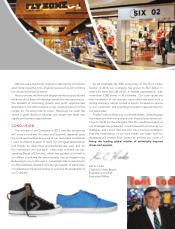
Fourth, we are no longer just a U.S.-focused company with
a modest international presence. We are now a large global
company. We operate more than 1,000 stores in 22 countries
outside the United States, as well as various local country web-
sites, and we are approaching $2 billion in international
sales. We also have another 73 stores in 9 countries operated
by our franchise partners. Clearly, people around the world
enjoy wearing the premium sneakers and athletic apparel that
we sell.
Finally, we are not just a bricks and mortar business.
We now have a strong, fast-growing collection of digital sites,
both in the United States and abroad. Our biggest digital
business, Eastbay, is the premier destination for the elite high
school or club athlete, and our store banner e-commerce
sites, such as footlocker.com, continue to increase sales at a
rapid pace, an impressive 40 percent rate in
2013. Our overall digital business has now
grown to 11 percent of our total sales.
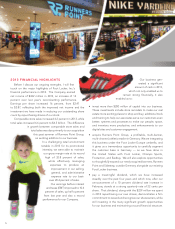
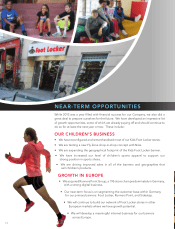
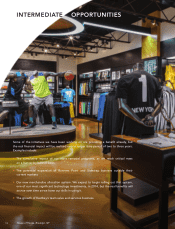
OPPORTUNITIES
The set of strengths I described
above lead directly to an exciting
number of signicant opportunities
for us to pursue over the next
several years. In the relatively near
term, which I dene as this year
and into next, we have several
initiatives already paying dividends
upon which to build. These include, rst,
our children’s business, the success of
which can be seen not just in our Kids Foot
Locker business, where sales increased at
a mid-teen pace in 2013, but in the growth
of our children’s business across all of our
banners, channels, and geographies. We
are doing a much better job buying and
displaying kids’ merchandise, and our
vendor partners have also improved their
product offerings.
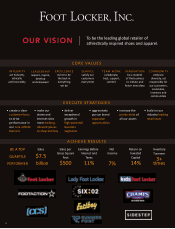
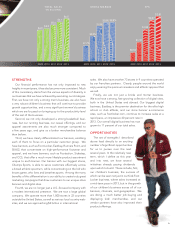
$1.10
$1.82
$2.47
30.0%
31.9%
32.8% 32.8%
27.7%
$5.0
$6.5
$6.1
EPS
GROSS MARGIN
TOTAL SALES
2009 2010 2011 2012 2013
$5.6
$2.87
$4.9
$0.54
2009 2010 2011 2012 2013 2009 2010 2011 2012 2013