Foot Locker 2013 Annual Report Download - page 6
Download and view the complete annual report
Please find page 6 of the 2013 Foot Locker annual report below. You can navigate through the pages in the report by either clicking on the pages listed below, or by using the keyword search tool below to find specific information within the annual report.-
 1
1 -
 2
2 -
 3
3 -
 4
4 -
 5
5 -
 6
6 -
 7
7 -
 8
8 -
 9
9 -
 10
10 -
 11
11 -
 12
12 -
 13
13 -
 14
14 -
 15
15 -
 16
16 -
 17
17 -
18
-
19
-
20
-
21
-
22
-
23
-
24
-
25
-
26
-
27
-
28
-
29
-
30
-
31
-
32
-
33
-
34
-
35
-
36
-
37
-
38
-
39
-
40
-
41
-
42
-
43
-
44
-
45
-
46
-
47
-
48
-
49
-
50
-
51
-
52
-
53
-
54
-
55
-
56
-
57
-
58
-
59
-
60
-
61
-
62
-
63
-
64
-
65
-
66
-
67
-
68
-
69
-
70
-
71
-
72
-
73
-
74
-
75
-
76
-
77
-
78
-
79
-
80
-
81
-
82
-
83
-
84
-
85
-
86
-
87
-
88
-
89
-
90
-
91
-
92
-
93
-
94
-
95
-
96
-
97
-
98
-
99
-
100
-
101
-
102
-
103
-
104
-
105
-
106
-
107
-
108
-
109
-
110
-
111
-
112
 |
 |
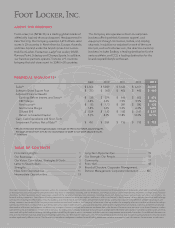
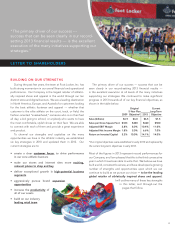
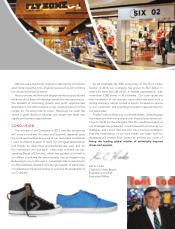
2013 FINANCIAL HIGHLIGHTS
Before I discuss our ongoing strengths, I will rst
touch on the major highlights of Foot Locker, Inc.’s
nancial performance in 2013. The Company earned
net income of $432 million in 2013, an increase of 14
percent over last year’s record-setting performance.
Earnings per share increased 16 percent, from $2.47
to $2.87, reecting both the improved net income and the
investment we have made in reducing our outstanding share
count by repurchasing shares of our stock.
Comparable store sales increased 4.2 percent in 2013, while
total sales increased 6.6 percent to $6.5 billion. The difference
in growth between comparable store sales and
total sales was due primarily to our acquisition
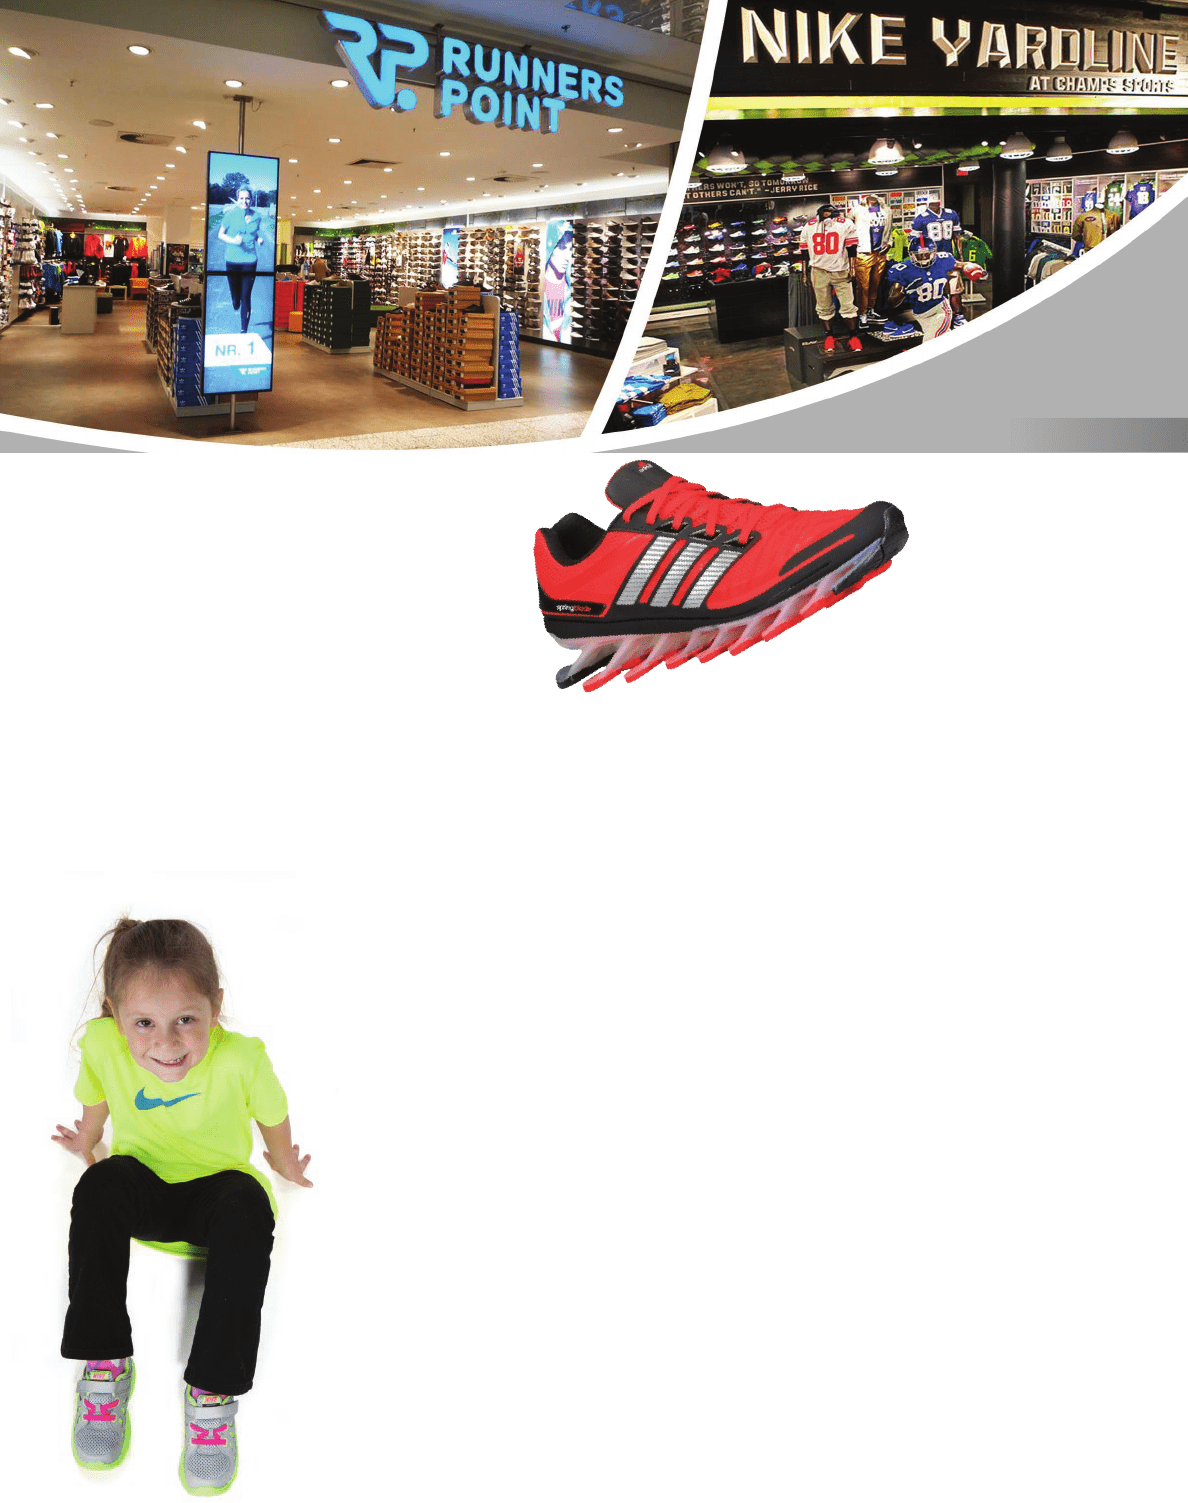
this past summer of Runners Point Group,
an exciting addition to our business.
In a challenging retail environment
notable in 2013 for its promotional
intensity, we were able to maintain
our gross margin rate at its record
high of 32.8 percent of sales,
while effectively managing
expenses to produce an
improvement in our selling,
general, and administrative
expense rate to our best-
ever 20.4 percent of sales.
Our earnings before interest
and taxes (EBIT) improved to 10.4
percent of sales, up half a percent
from last year and also a record
performance for our Company.
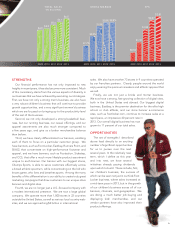
Our business gen-
erated a signicant
amount of cash in 2013,
which not only enabled us to
remain strong nancially, it also
enabled us to:
• invest more than $200 million of capital into our business.
These investments include store remodels to make our real
estate more exciting places to shop and buy; additional tools
and training to help our associates serve our customers even
better; systems and processes to make our people, space,
and inventory more productive; and enhancements to our
digital sites and customer engagement.
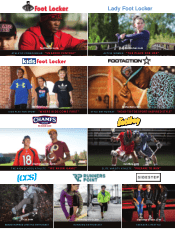
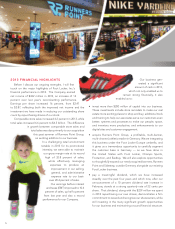
• acquire Runners Point Group, a protable, multi-banner,
multi-channel, athletic retailer in Germany. We are integrating
this business under the Foot Locker Europe umbrella, and
it gives us a tremendous opportunity to carefully segment
the customer base in Germany --- as we have done in
the United States with Foot Locker, Champs Sports,
Footaction, and Eastbay. We will also explore opportunities
to thoughtfully expand our newly-acquired banners, Runners
Point and Sidestep, outside Germany alongside our existing
Foot Locker business.
• pay a meaningful dividend, which we have increased
steadily over the past four years and which now, after our
announcement of a 10 percent dividend rate increase in
February, stands at a strong quarterly rate of 22 cents per
share. That dividend, along with the $229 million we spent
in 2013 repurchasing our own shares, demonstrates a rm
commitment to reward and recognize our shareowners, while
still investing in the many signicant growth opportunities
for our business and maintaining a sound nancial structure.
5