Foot Locker 2013 Annual Report Download - page 69
Download and view the complete annual report
Please find page 69 of the 2013 Foot Locker annual report below. You can navigate through the pages in the report by either clicking on the pages listed below, or by using the keyword search tool below to find specific information within the annual report.-
 1
1 -
2
-
3
-
4
-
5
-
6
-
7
-
8
-
9
-
10
-
11
-
12
-
13
-
14
-
15
-
16
-
17
-
18
-
19
-
20
-
21
-
22
-
23
-
24
-
25
-
26
-
27
-
28
-
29
-
30
-
31
-
32
-
33
-
34
-
35
-
36
-
37
-
38
-
39
-
40
-
41
-
42
-
43
-
44
-
45
-
46
-
47
-
48
-
49
-
50
-
51
-
52
-
53
-
54
-
55
-
56
-
57
-
58
-
 59
59 -
 60
60 -
 61
61 -
 62
62 -
 63
63 -
 64
64 -
 65
65 -
 66
66 -
 67
67 -
 68
68 -
 69
69 -
 70
70 -
 71
71 -
 72
72 -
 73
73 -
 74
74 -
 75
75 -
 76
76 -
 77
77 -
 78
78 -
 79
79 -
80
-
81
-
82
-
83
-
84
-
85
-
86
-
87
-
88
-
89
-
90
-
91
-
92
-
93
-
94
-
95
-
96
-
97
-
98
-
99
-
100
-
101
-
102
-
103
-
104
-
105
-
106
-
107
-
108
-
109
-
110
-
111
-
112
 |
 |

Foot Locker, Inc.
NOTES TO CONSOLIDATED FINANCIAL STATEMENTS
2. Acquisition − (continued)
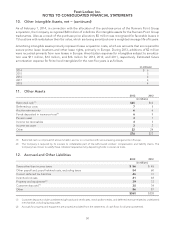
We determined that the tradenames have an indefinite life and will not be amortized. These tradenames will be
tested annually for impairment, along with the goodwill recorded for the purchase. The value of the favorable
leases will be amortized over the terms of the respective leases.
The amount of goodwill expected to be tax deductible is $5 million. The proforma effects of the acquisition
have not been presented, as their effects were not significant to the consolidated results of operations.
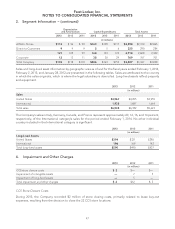
3. Segment Information
The Company has determined that its reportable segments are those that are based on its method of internal
reporting. As of February 1, 2014, the Company has two reportable segments, Athletic Stores and Direct-to-
Customers. The accounting policies of both segments are the same as those described in the Summary of
Significant Accounting Policies note. The Company evaluates performance based on several factors, of which
the primary financial measure is division results. Division profit reflects income before income taxes, corporate
expense, non-operating income, and net interest expense.
As discussed in detail in Note 2, Acquisition, the Company acquired Runners Point Group during the second
quarter of 2013. Sales and division results for the Runners Point Group stores, including Runners Point, Sidestep
and Run
2
, are included in the Athletic Stores segment since the date of acquisition. Sales and division results for
Tredex, a direct-to-customers subsidiary of Runners Point Group, are included in the Direct-to-Customers seg-
ment since the date of acquisition.
2013 2012 2011
(in millions)
Sales
Athletic Stores $5,790 $5,568 $5,110
Direct-to-Customers 715 614 513
Total sales $6,505 $6,182 $5,623
Operating Results
Athletic Stores
(1)
$ 656 $ 653 $ 495
Direct-to-Customers
(2)
84 65 45
740 718 540
Restructuring charge
(3)
—— (1)
Division profit 740 718 539
Less: Corporate expense
(4)
76 108 102
Operating profit 664 610 437
Other income 424
Interest expense, net 556
Income before income taxes $ 663 $ 607 $ 435
(1) The results for 2013 include a $2 million charge recorded in connection with the closure of all CCS stores. The results of 2012 include
a non-cash impairment charge of $5 million to write down long-lived assets of the CCS stores as a result of the Company’s decision
to close the stores during the first quarter of 2013.
(2) Included in the results for 2012 and 2011 are non-cash impairment charges of $7 million and $5 million, respectively, related to the
CCS business. See Note 4, Impairment and Other Charges for additional information.
(3) In 2011, the Company increased its 1993 Repositioning and 1991 Restructuring reserve by $1 million for repairs necessary to one of
the locations comprising this reserve. This amount is included in selling, general and administrative expenses.
(4) Corporate expense for 2013 reflects the reallocation of expense between corporate and the operating divisions. Based upon an
internal study of corporate expense, the allocation of such expenses to the operating divisions was increased by $27 million thereby
reducing corporate expense.
46