Foot Locker 2013 Annual Report Download - page 46
Download and view the complete annual report
Please find page 46 of the 2013 Foot Locker annual report below. You can navigate through the pages in the report by either clicking on the pages listed below, or by using the keyword search tool below to find specific information within the annual report.-
 1
1 -
2
-
3
-
4
-
5
-
6
-
7
-
8
-
9
-
10
-
11
-
12
-
13
-
14
-
15
-
16
-
17
-
18
-
19
-
20
-
21
-
22
-
23
-
24
-
25
-
26
-
27
-
28
-
29
-
30
-
31
-
32
-
33
-
34
-
35
-
 36
36 -
 37
37 -
 38
38 -
 39
39 -
 40
40 -
 41
41 -
 42
42 -
 43
43 -
 44
44 -
 45
45 -
 46
46 -
 47
47 -
 48
48 -
 49
49 -
 50
50 -
 51
51 -
 52
52 -
 53
53 -
 54
54 -
 55
55 -
 56
56 -
57
-
58
-
59
-
60
-
61
-
62
-
63
-
64
-
65
-
66
-
67
-
68
-
69
-
70
-
71
-
72
-
73
-
74
-
75
-
76
-
77
-
78
-
79
-
80
-
81
-
82
-
83
-
84
-
85
-
86
-
87
-
88
-
89
-
90
-
91
-
92
-
93
-
94
-
95
-
96
-
97
-
98
-
99
-
100
-
101
-
102
-
103
-
104
-
105
-
106
-
107
-
108
-
109
-
110
-
111
-
112
 |
 |

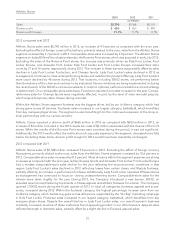
Athletic Stores reported a division profit of $653 million in 2012 as compared with $495 million in 2011, an
increase of $158 million. During the fourth quarter of 2012 an impairment charge of $5 million was recorded to
write down long-lived assets of the CCS stores as a result of the Company’s decision to close these stores.
Foreign currency fluctuations negatively affected division profit by approximately $9 million as compared with
the corresponding prior-year period. Division profit increased primarily as a result of strong sales and an
improved gross margin rate driven by improved leverage of the fixed expenses within gross margin, contrib-
uting to an overall profit flow-through of 34.5 percent.
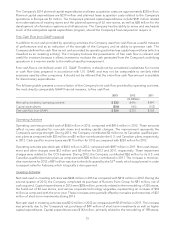
Direct-to-Customers
2013 2012 2011
(in millions)
Sales $ 715 $ 614 $513
Division profit $84 $65 $45
Division profit margin 11.7% 10.6% 8.8%
2013 compared with 2012
Direct-to-Customers sales increased 16.4 percent to $715 million in 2013, as compared with $614 million in
2012. Comparable sales increased 14.8 percent from the prior year. The Direct-to-Customers segment includes
$18 million of sales related to the e-commerce division of Runners Point Group, which the Company acquired
during the second quarter of 2013. Excluding these sales, the increase was primarily a result of continued
strong sales performance related to the Company’s store-banner websites, as well as increased Eastbay sales.
Of the total increase, sales from our store-banner websites comprised approximately three quarters of the
increase reflecting success of several initiatives, including improving the connectivity of the store banners to the
e-commerce sites, investments in technology to improve the shopping experience, and investments in making
the sites more engaging. These increases were offset, in part, by a further decline in the CCS business.
The Direct-to-Customers business generated division profit of $84 million in 2013, as compared with $65 million
in 2012. Division profit, as a percentage of sales, was 11.7 percent in 2013 and 10.6 percent in 2012. The 2013
results reflect the reallocation of corporate expense, discussed more fully below. Excluding this change division
profit margin would have been 12.3 percent. During 2012, an impairment charge of $7 million was recorded to
write down CCS intangible assets. Excluding these items, division profit increased by $17 million. The effect of
the acquisition was not significant to this segment’s division profit.
2012 compared with 2011
Direct-to-Customers sales increased 19.7 percent to $614 million in 2012, as compared with $513 million in
2011. On a comparable 52 week basis, sales increased 17.7 percent. The increase was primarily a result of
continued strong sales performance for the Company’s store-banner websites, as well as increased Eastbay
sales. Of the total increase, sales from our store-banner websites comprised approximately 60 percent of the
increase. This improvement reflected further investment in our websites in order to provide excellent service in
our digital channels, including easy navigation, timely shipping, helpful call center assistance, and entertaining
and engaging content.
The Direct-to-Customers business generated division profit of $65 million in 2012, as compared with $45 million
in 2011. Division profit, as a percentage of sales, was 10.6 percent in 2012 and 8.8 percent in 2011. During the
fourth quarters of 2012 and 2011, impairment charges of $7 million and $5 million, respectively, were recorded
to write down CCS intangible assets, specifically the non-amortizing tradename. The 2012 impairment was
primarily the result of continued reductions in revenue projections, coupled with a decrease in the assumed
royalty rate as a result of lower profitability. Excluding the impairment charges in each of the periods, division
profit increased by $22 million reflecting the strong sales performance and a lower expense rate.
Corporate Expense
Corporate expense consists of unallocated general and administrative expenses as well as depreciation and
amortization related to the Company’s corporate headquarters, centrally managed departments, unallocated
23