Foot Locker 2013 Annual Report Download - page 2
Download and view the complete annual report
Please find page 2 of the 2013 Foot Locker annual report below. You can navigate through the pages in the report by either clicking on the pages listed below, or by using the keyword search tool below to find specific information within the annual report.-
 1
1 -
 2
2 -
 3
3 -
 4
4 -
 5
5 -
 6
6 -
 7
7 -
 8
8 -
 9
9 -
 10
10 -
 11
11 -
 12
12 -
 13
13 -
14
-
15
-
16
-
17
-
18
-
19
-
20
-
21
-
22
-
23
-
24
-
25
-
26
-
27
-
28
-
29
-
30
-
31
-
32
-
33
-
34
-
35
-
36
-
37
-
38
-
39
-
40
-
41
-
42
-
43
-
44
-
45
-
46
-
47
-
48
-
49
-
50
-
51
-
52
-
53
-
54
-
55
-
56
-
57
-
58
-
59
-
60
-
61
-
62
-
63
-
64
-
65
-
66
-
67
-
68
-
69
-
70
-
71
-
72
-
73
-
74
-
75
-
76
-
77
-
78
-
79
-
80
-
81
-
82
-
83
-
84
-
85
-
86
-
87
-
88
-
89
-
90
-
91
-
92
-
93
-
94
-
95
-
96
-
97
-
98
-
99
-
100
-
101
-
102
-
103
-
104
-
105
-
106
-
107
-
108
-
109
-
110
-
111
-
112
 |
 |

President and Chief Executive Ofcer
and Chief Operating Ofcer
President and Chief Executive Ofcer
President and Chief Executive Ofcer
Chief Executive Ofcer
President and Chief Executive Ofcer
President and Chief Executive Ofcer
Chief Operating Ofcer
Chief Financial Ofcer
Chief Human Resources Ofcer
Chief Information Ofcer
Chief Accounting Ofcer
President and Chief Executive Ofcer President and Chief Executive Ofcer President and Chief Executive Ofcer
Foot Locker Asia/Pacic
President and Chief Executive Ofcer
Send certicates for transfer and
afliates.
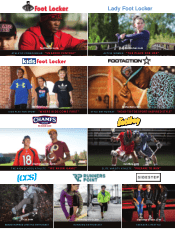
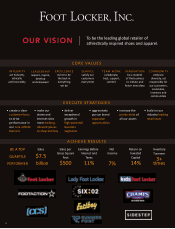
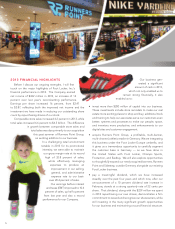
ABOUT THE COMPANY
Foot Locker, Inc. (NYSE: FL) is a leading global retailer of
athletically inspired shoes and apparel. Headquartered in
New York City, the Company operates 3,473 athletic retail
stores in 23 countries in North America, Europe, Australia,
and New Zealand under the brand names Foot Locker,
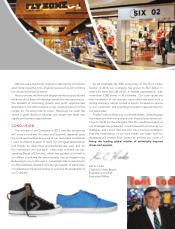
Kids Foot Locker, Footaction, Lady Foot Locker, SIX:02,
Runners Point, Sidestep and Champs Sports. In addition,
our franchise partners operate 73 stores in 9 countries,
bringing the total store count to 3,546 in 30 countries.
The Company also operates a direct-to-customers
business offering athletic footwear, apparel, and
equipment through its internet, mobile, and catalog
channels. In addition to websites for each of the store
banners, such as footlocker.com, the direct-to-customer
business includes Eastbay, a leading destination for the
serious athlete, and CCS, a leading destination for the
board-inspired lifestyle enthusiast.
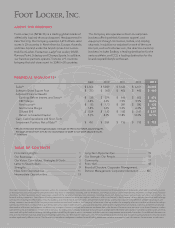
TABLE OF CONTENTS
Financial Highlights ....................................................... 1
Our Businesses .............................................................. 2
Our Vision, Core Values, Strategies & Goals ............... 3
Letter to Shareholders ................................................... 4
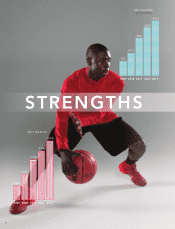
Strengths ........................................................................ 9
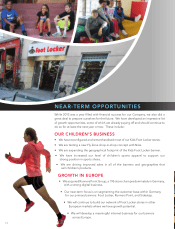
Near-Term Opportunities .............................................. 11
Intermediate Opportunities .......................................... 13
Long-Term Opportunities ............................................. 15
Our Strength: Our People ............................................. 15
Community ..................................................................... 17
Form 10-K ....................................................................... 18
Board of Directors, Corporate Management,
Division Management, Corporate Information ........... IBC
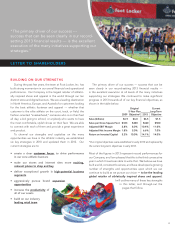
FINANCIAL HIGHLIGHTS*
2009 2010 2011 2012 2013
Sales** $ 4,854 $ 5,049 $ 5,623 $ 6,101 $ 6,505
Sales per Gross Square Foot $ 333 $ 360 $ 406 $ 443 $ 460
Adjusted Financial Results:
Earnings Before Interest and Taxes** $ 138 $ 274 $ 446 $ 602 $ 676
EBIT Margin 2.8% 5.4% 7.9% 9.9% 10.4%
Net Income** $ 85 $ 173 $ 281 $ 380 $ 432
Net Income Margin 1.8% 3.4% 5.0% 6.2% 6.6%
Diluted EPS $ 0.54 $ 1.10 $ 1.82 $ 2.47 $ 2.87
Return on Invested Capital 5.3% 8.3% 11.8% 14.2% 14.1%
Cash, Cash Equivalents and Short-Term
Investment Position, Net of Debt** $ 451 $ 559 $ 716 $ 795 $ 728
** In Millions
1