Foot Locker 2013 Annual Report Download - page 34
Download and view the complete annual report
Please find page 34 of the 2013 Foot Locker annual report below. You can navigate through the pages in the report by either clicking on the pages listed below, or by using the keyword search tool below to find specific information within the annual report.-
 1
1 -
2
-
3
-
4
-
5
-
6
-
7
-
8
-
9
-
10
-
11
-
12
-
13
-
14
-
15
-
16
-
17
-
18
-
19
-
20
-
21
-
22
-
23
-
 24
24 -
 25
25 -
 26
26 -
 27
27 -
 28
28 -
 29
29 -
 30
30 -
 31
31 -
 32
32 -
 33
33 -
 34
34 -
 35
35 -
 36
36 -
 37
37 -
 38
38 -
 39
39 -
 40
40 -
 41
41 -
 42
42 -
 43
43 -
 44
44 -
45
-
46
-
47
-
48
-
49
-
50
-
51
-
52
-
53
-
54
-
55
-
56
-
57
-
58
-
59
-
60
-
61
-
62
-
63
-
64
-
65
-
66
-
67
-
68
-
69
-
70
-
71
-
72
-
73
-
74
-
75
-
76
-
77
-
78
-
79
-
80
-
81
-
82
-
83
-
84
-
85
-
86
-
87
-
88
-
89
-
90
-
91
-
92
-
93
-
94
-
95
-
96
-
97
-
98
-
99
-
100
-
101
-
102
-
103
-
104
-
105
-
106
-
107
-
108
-
109
-
110
-
111
-
112
 |
 |
PART II
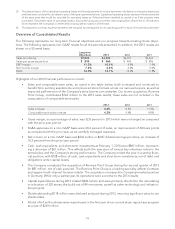
Item 5. Market for the Company’s Common Equity, Related Stockholder Matters and Issuer Purchases
of Equity Securities
Foot Locker, Inc. common stock (ticker symbol ‘‘FL’’) is listed on The New York Stock Exchange as well as on the
Börse Stuttgart stock exchange in Germany. As of February 1, 2014, the Company had 16,207 shareholders of
record owning 145,426,822 common shares.
The following table provides, for the period indicated, the intra-day high and low sales prices for the Compa-
ny’s common stock:
2013 2012
High Low High Low
1
st
Quarter $35.64 $31.30 $32.27 $26.00
2
nd
Quarter 37.70 32.61 34.00 27.86
3
rd
Quarter 37.85 31.91 37.65 32.51
4
th
Quarter 41.73 34.09 36.09 31.07
During each of the quarters of 2013 the Company declared a dividend of $0.20 per share. The Board of Direc-
tors reviews the dividend policy and rate, taking into consideration the overall financial and strategic outlook
for our earnings, liquidity, and cash flow projections. On February 18, 2014, the Board of Directors declared a
quarterly dividend of $0.22 per share to be paid on May 2, 2014. This dividend represents a 10 percent increase
over the Company’s previous quarterly per share amount.
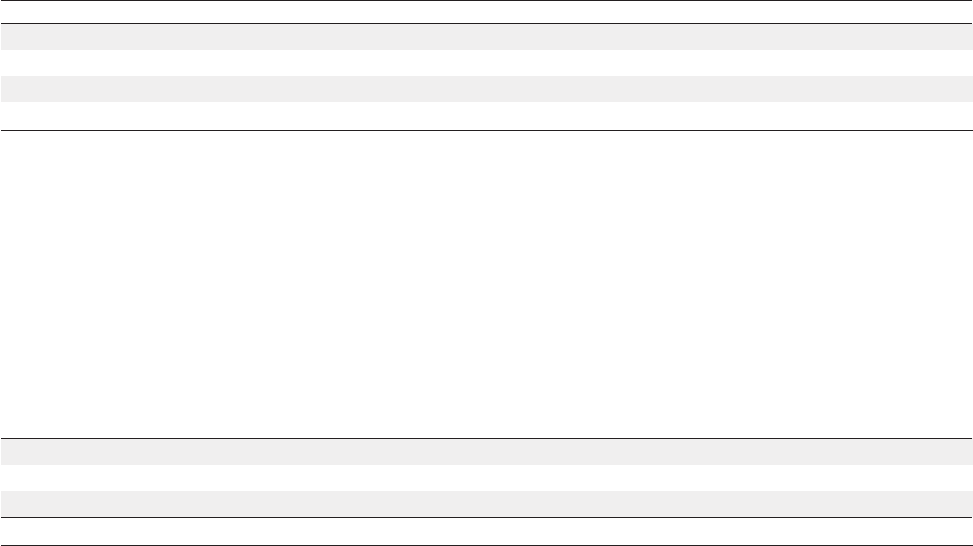
The following table is a summary of our fourth quarter share repurchases:
Date Purchased
Total
Number of
Shares
Purchased
(1)
Average
Price Paid
per Share
(1)
Total Number of
Shares
Purchased as
Part of Publicly
Announced
Program
(2)
Approximate
Dollar Value of
Shares that may
yet be Purchased
Under the
Program
(2)
Nov. 3, 2013 − Nov. 30, 2013 164,322 $38.96 164,322 $426,826,201
Dec. 1, 2013 − Jan. 4, 2014 1,411,993 $39.87 1,410,713 $370,576,339
Jan. 5, 2014 − Feb. 1, 2014 — $ — — $370,576,339
1,576,315 $39.78 1,575,035
(1) These columns also reflect shares purchased in connection with stock swaps. The calculation of the average price paid per share
includes all fees, commissions, and other costs associated with the repurchase of such shares.
(2) On February 20, 2013, the Board of Directors approved a new 3-year, $600 million share repurchase program extending through
January 2016, replacing the Company’s previous $400 million program which terminated on that date. Through February 1, 2014, 6.4
million shares of common stock were purchased under the current program, for an aggregate cost of $229 million.
11