Foot Locker 2013 Annual Report Download - page 45
Download and view the complete annual report
Please find page 45 of the 2013 Foot Locker annual report below. You can navigate through the pages in the report by either clicking on the pages listed below, or by using the keyword search tool below to find specific information within the annual report.-
 1
1 -
2
-
3
-
4
-
5
-
6
-
7
-
8
-
9
-
10
-
11
-
12
-
13
-
14
-
15
-
16
-
17
-
18
-
19
-
20
-
21
-
22
-
23
-
24
-
25
-
26
-
27
-
28
-
29
-
30
-
31
-
32
-
33
-
34
-
 35
35 -
 36
36 -
 37
37 -
 38
38 -
 39
39 -
 40
40 -
 41
41 -
 42
42 -
 43
43 -
 44
44 -
 45
45 -
 46
46 -
 47
47 -
 48
48 -
 49
49 -
 50
50 -
 51
51 -
 52
52 -
 53
53 -
 54
54 -
 55
55 -
56
-
57
-
58
-
59
-
60
-
61
-
62
-
63
-
64
-
65
-
66
-
67
-
68
-
69
-
70
-
71
-
72
-
73
-
74
-
75
-
76
-
77
-
78
-
79
-
80
-
81
-
82
-
83
-
84
-
85
-
86
-
87
-
88
-
89
-
90
-
91
-
92
-
93
-
94
-
95
-
96
-
97
-
98
-
99
-
100
-
101
-
102
-
103
-
104
-
105
-
106
-
107
-
108
-
109
-
110
-
111
-
112
 |
 |
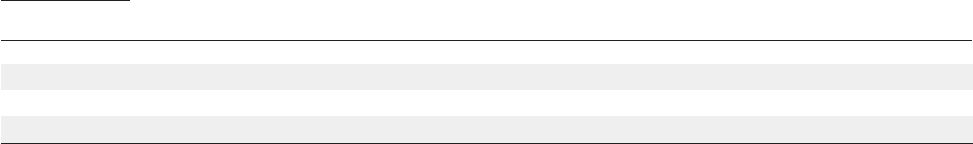
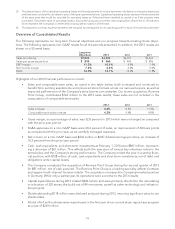
Athletic Stores
2013 2012 2011
(in millions)
Sales $5,790 $5,568 $5,110
Division profit $ 656 $ 653 $ 495
Division profit margin 11.3% 11.7% 9.7%
2013 compared with 2012
Athletic Stores sales were $5,790 million in 2013, an increase of 4.0 percent as compared with the prior year.
Excluding the effect of foreign currency fluctuations, primarily related to the euro, sales from the Athletic Stores
segment increased by 3.7 percent in 2013. Comparable-store sales increased by 3.0 percent. The Athletic Stores
segment includes $146 million of sales related to the Runners Point stores, which was acquired in early July 2013.
Excluding the sales of the Runners Point stores, the increase was primarily driven by Kids Foot Locker, Foot
Locker Europe, and domestic Foot Locker. Kids Foot Locker and Foot Locker Europe increased their store
count by 31 and 14 stores, respectively, during 2013. The increase in these banners was partially offset by sales
declines in Lady Foot Locker, Footaction, and Champs Sports. Lady Foot Locker’s sales declined in 2013 as
management continues to close underperforming stores and redefine the product offerings. Lady Foot Locker’s
store count declined by 46 stores during 2013. Test locations, including SIX:02 stores, are performing better
than the balance of the chain and continue to be evaluated. Various initiatives are being implemented including
the recent launch of the SIX:02 e-commerce website, in order to optimize performance before a roll-out strategy
is determined. On a comparable-store sales basis, Footaction reported a modest increase for the year. Compa-
rable-store sales for Champs Sports were negatively affected, in part, by the level of store remodel projects,
which require temporary store closure during remodel.
Within the Athletic Stores segment footwear was the biggest driver, led by our children’s category, which had
strong gains across all banners. Footwear sales increased in our largest category, basketball, which benefited
from key marquee player shoes. The segment is also benefiting from the continued expansion of the shop-in-
shop partnerships with our various vendors.
Athletic Stores reported a division profit of $656 million in 2013 as compared with $653 million in 2012, an
increase of $3 million. Included in the 2013 results are costs of $2 million associated with the closure of the CCS
stores. While the results of the Runners Point stores were accretive during the period, it was not significant.
Additionally, the 2013 results reflect the reallocation of corporate expense to this segment, discussed more fully
below. Excluding these items, division profit margin for 2013 would have been essentially unchanged.
2012 compared with 2011
Athletic Stores sales of $5,568 million increased 9.0 percent in 2012. Excluding the effect of foreign currency
fluctuations, primarily related to the euro, sales from the Athletic Stores segment increased by 10.6 percent in
2012. Comparable-store sales increased by 8.5 percent. Most divisions within this segment experienced strong
increases as compared with the prior year, led by Champs Sports and domestic Foot Locker. Foot Locker Europe
had a modest comparable-store sales decline for the year reflecting the macroeconomic conditions in that
region. Lady Foot Locker’s sales declined in 2012 reflecting losses from certain classic and lifestyle footwear,
partially offset by an increase in performance footwear. Additionally, Lady Foot Locker operated 29 fewer stores
as management has continued to focus on closing underperforming stores. Comparable-store sales for the
division were down slightly for the year. During 2012, the Company introduced a new banner, SIX:02, an
elevated retail concept featuring top brands in fitness apparel and athletic footwear for women. The Company
opened 3 SIX:02 stores during the fourth quarter of 2012. In total, all categories, footwear, apparel and acces-
sories, increased during 2012. Within the footwear category, the highest percentage increase came from our
children’s category, which had strong gains across all banners, supported by the ‘‘Go Big’’ marketing campaign
in Kids Foot Locker. Footwear sales increased in our largest category, basketball, which benefited from key
marquee player shoes. Despite the overall decline in Lady Foot Locker sales, our overall women’s business
modestly increased, as some of those customers found appealing product in our other banners. Apparel sales
reflected strength in domestic sales, partially offset by a slight decline in Europe’s apparel sales.
22