Foot Locker 2013 Annual Report Download - page 41
Download and view the complete annual report
Please find page 41 of the 2013 Foot Locker annual report below. You can navigate through the pages in the report by either clicking on the pages listed below, or by using the keyword search tool below to find specific information within the annual report.-
 1
1 -
2
-
3
-
4
-
5
-
6
-
7
-
8
-
9
-
10
-
11
-
12
-
13
-
14
-
15
-
16
-
17
-
18
-
19
-
20
-
21
-
22
-
23
-
24
-
25
-
26
-
27
-
28
-
29
-
30
-
 31
31 -
 32
32 -
 33
33 -
 34
34 -
 35
35 -
 36
36 -
 37
37 -
 38
38 -
 39
39 -
 40
40 -
 41
41 -
 42
42 -
 43
43 -
 44
44 -
 45
45 -
 46
46 -
 47
47 -
 48
48 -
 49
49 -
 50
50 -
 51
51 -
52
-
53
-
54
-
55
-
56
-
57
-
58
-
59
-
60
-
61
-
62
-
63
-
64
-
65
-
66
-
67
-
68
-
69
-
70
-
71
-
72
-
73
-
74
-
75
-
76
-
77
-
78
-
79
-
80
-
81
-
82
-
83
-
84
-
85
-
86
-
87
-
88
-
89
-
90
-
91
-
92
-
93
-
94
-
95
-
96
-
97
-
98
-
99
-
100
-
101
-
102
-
103
-
104
-
105
-
106
-
107
-
108
-
109
-
110
-
111
-
112
 |
 |
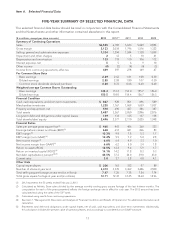
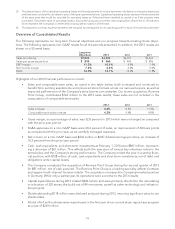
(3) The determination of the capitalized operating leases and the adjustments to income have been calculated on a lease-by-lease basis
and have been consistently calculated in each of the years presented above. Capitalized operating leases represent the best estimate
of the asset base that would be recorded for operating leases as if they had been classified as capital or as if the property were
purchased. The present value of operating leases is discounted using various interest rates ranging from 2.8 percent to 14.5 percent,
which represent the Company’s incremental borrowing rate at inception of the lease.
(4) The adjusted income tax expense represents the marginal tax rate applied to net operating profit for each of the periods presented.
Overview of Consolidated Results
The following represents our long-term financial objectives and our progress towards meeting those objec-
tives. The following represents non-GAAP results for all the periods presented. In addition, the 2012 results are
shown on a 52-week basis.
Long-term
Objectives 2013 2012 2011
Sales (in millions) $7,500 $6,505 $6,101 $5,623
Sales per gross square foot $ 500 $ 460 $ 443 $ 406
EBIT margin 11.0% 10.4% 9.9% 7.9%
Net income margin 7.0% 6.6% 6.2% 5.0%
ROIC 14.0% 14.1% 14.2% 11.8%
Highlights of our 2013 financial performance include:
• Sales and comparable-store sales, as noted in the table below, both increased and continued to
benefit from exciting assortments and enhanced store formats across our various banners, as well as
improved performance of the Company’s store banner.com websites. Our recent acquisition, Runners
Point Group, contributed $164 million to the 2013 sales results; these sales are not included in the
computation of comparable-store sales.
2013 2012 2011
Sales increase 6.6% 8.5% 11.4%
Comparable-store sales increase 4.2% 9.4% 9.8%
• Gross margin, as a percentage of sales, was 32.8 percent in 2013 which was unchanged as compared
with the prior-year period.
• SG&A expenses on a non-GAAP basis were 20.4 percent of sales, an improvement of 60 basis points
as compared with the prior year, as we carefully managed expenses.
• Net income on a non-GAAP basis was $432 million or $2.87 diluted earnings per share, an increase of
16.2 percent from the prior-year period.
• Cash, cash equivalents, and short-term investments at February 1, 2014 were $867 million, represent-
ing a decrease of $61 million. This reflects both the execution of various key initiatives noted in the
items below and the Company’s strong performance. The Company ended the year in a strong finan-
cial position, with $728 million of cash, cash equivalents and short-term investments, net of debt and
obligations under capital leases.
• The Company completed the acquisition of Runners Point Group during the second quarter of 2013
for $81 million, net of cash acquired. The Runners Point Group is a leading specialty athletic footwear
and apparel multi-channel German retailer. The acquisition increases the Company’s market position
in Germany. While only a partial year, its operations were accretive to the 2013 results.
• Capital expenditures during 2013 totaled $206 million and were primarily directed to the remodeling
or relocation of 320 stores, the build-out of 84 new stores, as well as other technology and infrastruc-
ture projects.
• Dividends totaling $118 million were declared and paid during 2013, returning significant value to our
shareholders.
• A total of 6.4 million shares were repurchased in the first year of our current share repurchase program
at a cost of $229 million.
18