Foot Locker 2013 Annual Report Download - page 39
Download and view the complete annual report
Please find page 39 of the 2013 Foot Locker annual report below. You can navigate through the pages in the report by either clicking on the pages listed below, or by using the keyword search tool below to find specific information within the annual report.-
 1
1 -
2
-
3
-
4
-
5
-
6
-
7
-
8
-
9
-
10
-
11
-
12
-
13
-
14
-
15
-
16
-
17
-
18
-
19
-
20
-
21
-
22
-
23
-
24
-
25
-
26
-
27
-
28
-
 29
29 -
 30
30 -
 31
31 -
 32
32 -
 33
33 -
 34
34 -
 35
35 -
 36
36 -
 37
37 -
 38
38 -
 39
39 -
 40
40 -
 41
41 -
 42
42 -
 43
43 -
 44
44 -
 45
45 -
 46
46 -
 47
47 -
 48
48 -
 49
49 -
50
-
51
-
52
-
53
-
54
-
55
-
56
-
57
-
58
-
59
-
60
-
61
-
62
-
63
-
64
-
65
-
66
-
67
-
68
-
69
-
70
-
71
-
72
-
73
-
74
-
75
-
76
-
77
-
78
-
79
-
80
-
81
-
82
-
83
-
84
-
85
-
86
-
87
-
88
-
89
-
90
-
91
-
92
-
93
-
94
-
95
-
96
-
97
-
98
-
99
-
100
-
101
-
102
-
103
-
104
-
105
-
106
-
107
-
108
-
109
-
110
-
111
-
112
 |
 |

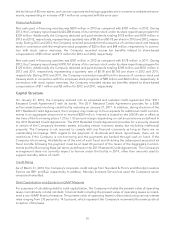
Franchise Operations
In 2006, the Company entered into a ten-year area development agreement with the Alshaya Trading Co.
W.L.L., for the operation of Foot Locker stores located within the Middle East, subject to certain restrictions. In
2007, the Company entered into a ten-year agreement with another third party for the exclusive right to open
and operate Foot Locker stores in the Republic of Korea. Additionally, franchise stores located in Germany and
Switzerland operate under the Runners Point and Stepside banners.
A total of 73 franchised stores were operating at February 1, 2014. Of these stores, 27 are operating in the
Middle East, 27 are operating in Germany and Switzerland, and 19 are operating in the Republic of Korea.
Royalty income from the franchised stores was not significant for any of the periods presented. These stores are
not included in the Company’s operating store count above.
Reconciliation of Non-GAAP Measures
In the following tables, the Company has presented certain financial measures and ratios identified as non-
GAAP. The Company believes this non-GAAP information is a useful measure to investors because it allows for
a more direct comparison of the Company’s performance for 2013 as compared with prior years and is useful in
assessing the Company’s progress in achieving its long-term financial objectives. The 2013 results represent the
52 weeks ended February 1, 2014 as compared with 53 weeks in 2012, and 52 weeks in the 2011 reporting year.
The following represents a reconciliation of the non-GAAP measures discussed throughout the Overview of
Consolidated Results:
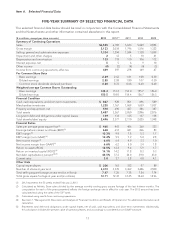
2013 2012 2011
(in millions, except per share amounts)
Sales:
Sales $6,505 $6,182 $5,623
53
rd
week —81 —
Sales excluding 53
rd
week (non-GAAP) $6,505 $6,101 $5,623
Pre-tax income:
Income before income taxes $ 663 $ 607 $ 435
Pre-tax amounts excluded from GAAP:
Runners Point Group integration and acquisition costs 6——
Impairment and other charges 212 5
53
rd
week —(22) —
Total pre-tax amounts excluded 8(10) 5
Income before income taxes (non-GAAP) $ 671 $ 597 $ 440
Calculation of Earnings Before Interest and Taxes (EBIT):
Income before income taxes $ 663 $ 607 $ 435
Interest expense, net 556
EBIT $ 668 $ 612 $ 441
Income before income taxes (non-GAAP) $ 671 $ 597 $ 440
Interest expense, net 556
EBIT (non-GAAP) $ 676 $ 602 $ 446
EBIT margin % 10.3% 9.9% 7.8%
EBIT margin % (non-GAAP) 10.4% 9.9% 7.9%
After-tax income:
Net income $ 429 $ 397 $ 278
After-tax amounts excluded from GAAP:
Runners Point Group acquisition and integration costs 5——
Impairment and other charges 173
53
rd
week —(14) —
Settlement of foreign tax audits (3) (9) —
Canadian tax rate changes —(1) —
Net income (non-GAAP) $ 432 $ 380 $ 281
16