Foot Locker 2013 Annual Report Download - page 86
Download and view the complete annual report
Please find page 86 of the 2013 Foot Locker annual report below. You can navigate through the pages in the report by either clicking on the pages listed below, or by using the keyword search tool below to find specific information within the annual report.-
 1
1 -
2
-
3
-
4
-
5
-
6
-
7
-
8
-
9
-
10
-
11
-
12
-
13
-
14
-
15
-
16
-
17
-
18
-
19
-
20
-
21
-
22
-
23
-
24
-
25
-
26
-
27
-
28
-
29
-
30
-
31
-
32
-
33
-
34
-
35
-
36
-
37
-
38
-
39
-
40
-
41
-
42
-
43
-
44
-
45
-
46
-
47
-
48
-
49
-
50
-
51
-
52
-
53
-
54
-
55
-
56
-
57
-
58
-
59
-
60
-
61
-
62
-
63
-
64
-
65
-
66
-
67
-
68
-
69
-
70
-
71
-
72
-
73
-
74
-
75
-
 76
76 -
 77
77 -
 78
78 -
 79
79 -
 80
80 -
 81
81 -
 82
82 -
 83
83 -
 84
84 -
 85
85 -
 86
86 -
 87
87 -
 88
88 -
 89
89 -
 90
90 -
 91
91 -
 92
92 -
 93
93 -
 94
94 -
 95
95 -
 96
96 -
97
-
98
-
99
-
100
-
101
-
102
-
103
-
104
-
105
-
106
-
107
-
108
-
109
-
110
-
111
-
112
 |
 |

Foot Locker, Inc.
NOTES TO CONSOLIDATED FINANCIAL STATEMENTS
21. Retirement Plans and Other Benefits − (continued)
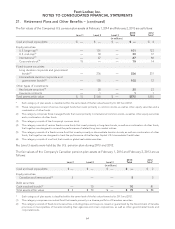
The following initial and ultimate cost trend rate assumptions were used to determine the net periodic cost
under the SERP Medical Plan:
Medical Trend Rate Dental Trend Rate
2013 2012 2011 2013 2012 2011
Initial cost trend rate 7.50% 8.00% 8.50% 5.00% 5.50% 5.50%
Ultimate cost trend rate 5.00% 5.00% 5.00% 5.00% 5.00% 5.00%
Year that the ultimate cost trend rate
is reached 2018 2018 2016 2013 2013 2012
A one percentage-point change in the assumed health care cost trend rates would have the following effects
on the SERP Medical Plan:
1% Increase 1% (Decrease)
(in millions)
Effect on total service and interest cost components $ — $ —
Effect on accumulated postretirement benefit obligation 2 (2)
Plan Assets
During 2013, the target composition of the Company’s U.S. plan assets was 40 percent equity and 60 percent
fixed-income securities. The Company may alter the targets from time to time depending on market conditions
and the funding requirements of the pension plan. This current asset allocation will limit volatility with regard to
the funded status of the plan, but will result in higher pension expense due to the lower long-term rate of return
associated with fixed-income securities. Due to market conditions and other factors, actual asset allocations
may vary from the target allocation outlined above. The Company believes that plan assets are invested in a
prudent manner with an objective of providing a total return that, over the long term, provides sufficient assets
to fund benefit obligations, taking into account the Company’s expected contributions and the level of risk
deemed appropriate. The Company’s investment strategy seeks to utilize asset classes with differing rates of
return, volatility, and correlation in order to reduce risk by providing diversification relative to equities. Diversi-
fication within asset classes is also utilized to ensure that there are no significant concentrations of risk in plan
assets and to reduce the effect that the return on any single investment may have on the entire portfolio.
The target composition of the Company’s Canadian plan assets is 95 percent debt securities and 5 percent
equity. The Company believes that plan assets are invested in a prudent manner with the same overall objec-
tive and investment strategy as noted above for the U.S. pension plan. The bond portfolio is comprised of
government and corporate bonds chosen to match the duration of the pension plan’s benefit payment obliga-
tions. This current asset allocation will limit future volatility with regard to the funded status of the plan. This
allocation has resulted in higher pension expense due to the lower long-term rate of return associated with
fixed-income securities.
The assets related to the Runners Point Group pension plans were not significant.
Valuation of Investments
Significant portions of plan assets are invested in commingled trust funds. These funds are valued at the net
asset value of units held by the plan at year end. Stocks traded on U.S. security exchanges are valued at closing
market prices on the measurement date.
63