Foot Locker 2013 Annual Report Download - page 44
Download and view the complete annual report
Please find page 44 of the 2013 Foot Locker annual report below. You can navigate through the pages in the report by either clicking on the pages listed below, or by using the keyword search tool below to find specific information within the annual report.-
 1
1 -
2
-
3
-
4
-
5
-
6
-
7
-
8
-
9
-
10
-
11
-
12
-
13
-
14
-
15
-
16
-
17
-
18
-
19
-
20
-
21
-
22
-
23
-
24
-
25
-
26
-
27
-
28
-
29
-
30
-
31
-
32
-
33
-
 34
34 -
 35
35 -
 36
36 -
 37
37 -
 38
38 -
 39
39 -
 40
40 -
 41
41 -
 42
42 -
 43
43 -
 44
44 -
 45
45 -
 46
46 -
 47
47 -
 48
48 -
 49
49 -
 50
50 -
 51
51 -
 52
52 -
 53
53 -
 54
54 -
55
-
56
-
57
-
58
-
59
-
60
-
61
-
62
-
63
-
64
-
65
-
66
-
67
-
68
-
69
-
70
-
71
-
72
-
73
-
74
-
75
-
76
-
77
-
78
-
79
-
80
-
81
-
82
-
83
-
84
-
85
-
86
-
87
-
88
-
89
-
90
-
91
-
92
-
93
-
94
-
95
-
96
-
97
-
98
-
99
-
100
-
101
-
102
-
103
-
104
-
105
-
106
-
107
-
108
-
109
-
110
-
111
-
112
 |
 |

Group, the Company recorded a tax expense of $1 million related to non-deductible acquisition costs. Exclud-
ing these items as well as the reserve releases in 2012, the effective tax rate for 2013 decreased as compared
with 2012 primarily due to the effect of full implementation of international tax planning initiatives in 2013.
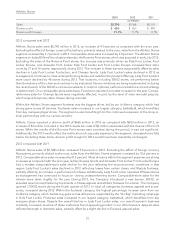
The effective tax rate for 2012 was 34.6 percent, as compared with 36.0 percent in 2011. The effective tax rate
for 2012 includes reserve releases of $13 million due to foreign and domestic audit settlements and lapses of
statute of limitations. Additionally, included in 2012 are one time benefits totaling $4 million, representing
foreign tax law changes of $2 million, additional U.S. tax credits of $1 million, and a $1 million benefit related
to a Canadian provincial tax rate change that increased the value of the Company’s net deferred tax assets. The
2011 effective rate included a benefit of $3 million from reserve releases as well as other true-up adjustments.
Excluding these items, the effective tax rate increased primarily due to the higher proportion of income earned
in higher tax jurisdictions in 2012.
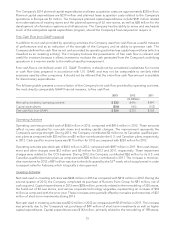
Segment Information
The Company’s two reportable segments, Athletic Stores and Direct-to-Customers, are based on its method of
internal reporting. The Company evaluates performance based on several factors, the primary financial measure
of which is division results. Division profit reflects income before income taxes, corporate expense, non-oper-
ating income, and net interest expense.
2013 2012 2011
(in millions)
Sales
Athletic Stores $5,790 $5,568 $5,110
Direct-to-Customers 715 614 513
$6,505 $6,182 $5,623
Operating Results
Athletic Stores
(1)
$ 656 $ 653 $ 495
Direct-to-Customers
(2)
84 65 45
740 718 540
Restructuring charge
(3)
—— (1)
Division profit 740 718 539
Less: Corporate expense
(4)
76 108 102
Operating profit 664 610 437
Other income
(5)
424
Earnings before interest expense and income taxes 668 612 441
Interest expense, net 556
Income before income taxes $ 663 $ 607 $ 435
(1) The results for 2013 include a $2 million charge recorded in connection with the closure of all CCS stores. The results of 2012 include
a non-cash impairment charge of $5 million to write down long-lived assets of the CCS stores as a result of the Company’s decision
to close the stores during the first quarter of 2013.
(2) Included in the results for 2012 and 2011 are non-cash impairment charges of $7 million and $5 million, respectively, related to the
CCS business.
(3) In 2011, the Company increased its 1993 Repositioning and 1991 Restructuring reserve by $1 million for repairs necessary to one of
the locations comprising this reserve. This amount is included in selling, general and administrative expenses.
(4) Corporate expense for 2013 reflects the reallocation of expense between corporate and the operating divisions. Based upon an
internal study of corporate expense, the allocation of such expenses to the operating divisions was increased by $27 million thereby
reducing corporate expense.
(5) Other income includes non-operating items such as: gains from insurance recoveries; discounts/premiums paid on the repurchase
and retirement of bonds; royalty income; and the changes in fair value, premiums paid, and realized gains associated with foreign
currency option contracts.
21