Foot Locker 2013 Annual Report Download - page 50
Download and view the complete annual report
Please find page 50 of the 2013 Foot Locker annual report below. You can navigate through the pages in the report by either clicking on the pages listed below, or by using the keyword search tool below to find specific information within the annual report.-
 1
1 -
2
-
3
-
4
-
5
-
6
-
7
-
8
-
9
-
10
-
11
-
12
-
13
-
14
-
15
-
16
-
17
-
18
-
19
-
20
-
21
-
22
-
23
-
24
-
25
-
26
-
27
-
28
-
29
-
30
-
31
-
32
-
33
-
34
-
35
-
36
-
37
-
38
-
39
-
 40
40 -
 41
41 -
 42
42 -
 43
43 -
 44
44 -
 45
45 -
 46
46 -
 47
47 -
 48
48 -
 49
49 -
 50
50 -
 51
51 -
 52
52 -
 53
53 -
 54
54 -
 55
55 -
 56
56 -
 57
57 -
 58
58 -
 59
59 -
 60
60 -
61
-
62
-
63
-
64
-
65
-
66
-
67
-
68
-
69
-
70
-
71
-
72
-
73
-
74
-
75
-
76
-
77
-
78
-
79
-
80
-
81
-
82
-
83
-
84
-
85
-
86
-
87
-
88
-
89
-
90
-
91
-
92
-
93
-
94
-
95
-
96
-
97
-
98
-
99
-
100
-
101
-
102
-
103
-
104
-
105
-
106
-
107
-
108
-
109
-
110
-
111
-
112
 |
 |

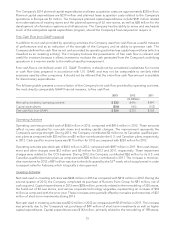
Operating leases are the primary financing vehicle used to fund store expansion and, therefore, we believe that
the inclusion of the present value of operating leases in total debt is useful to our investors, credit constituen-
cies, and rating agencies.
The following table sets forth the components of the Company’s capitalization, both with and without the
present value of operating leases:
2013 2012
(in millions)
Long-term debt and obligations under capital leases $ 139 $ 133
Present value of operating leases 2,571 2,202
Total debt including the present value of operating leases 2,710 2,335
Less:
Cash and cash equivalents 858 880
Short-term investments 948
Total net debt including the present value of operating leases 1,843 1,407
Shareholders’ equity 2,496 2,377
Total capitalization $4,339 $3,784
Total net debt capitalization percent —% —%
Total net debt capitalization percent including the present value of operating leases
(non-GAAP) 42.5% 37.2%
The Company’s cash, cash equivalents, and short-term investments decreased by $61 million during 2013,
representing the acquisition of the Runners Point Group offset in large part by the result of strong cash flow
generation from operating activities.
Including the present value of operating leases, the Company’s net debt capitalization percent increased
530 basis points in 2013. The change in total debt including the present value of the operating leases, as
compared with the prior-year period, primarily reflects the acquisition of Runners Point Group and their
associated lease liabilities, the effect of lease renewals, and the effect of foreign currency fluctuations, offset
in part by store closures.
Contractual Obligations and Commitments
The following tables represent the scheduled maturities of the Company’s contractual cash obligations and
other commercial commitments at February 1, 2014:
Payments Due by Fiscal Period
Contractual Cash Obligations Total 2014 2015 − 2016 2017 − 2018 2019 and
Beyond
(in millions)
Long-term debt
(1)
$ 206 $11 $ 22 $ 22 $ 151
Operating leases
(2)
3,308 558 967 693 1,090
Capital leases 8 35— —
Other long-term liabilities
(3)
22—— —
Total contractual cash obligations $3,524 $574 $994 $715 $1,241
Payments Due by Fiscal Period
Other Commercial Commitments
Total
Amounts
Committed 2014 2015 − 2016 2017 − 2018 2019 and
Beyond
(in millions)
Unused line of credit
(4)
$ 199 $— $199 $— $—
Standby letters of credit 1 —1— —
Purchase commitments
(5)
2,187 2,187 —— —
Other
(6)
35 20 15 — —
Total commercial commitments $2,422 $2,207 $216 $— $—
27