Albertsons 2004 Annual Report Download - page 84
Download and view the complete annual report
Please find page 84 of the 2004 Albertsons annual report below. You can navigate through the pages in the report by either clicking on the pages listed below, or by using the keyword search tool below to find specific information within the annual report.-
 1
1 -
2
-
3
-
4
-
5
-
6
-
7
-
8
-
9
-
10
-
11
-
12
-
13
-
14
-
15
-
16
-
17
-
18
-
19
-
20
-
21
-
22
-
23
-
24
-
25
-
26
-
27
-
28
-
29
-
30
-
31
-
32
-
33
-
34
-
35
-
36
-
37
-
38
-
39
-
40
-
41
-
42
-
43
-
44
-
45
-
46
-
47
-
48
-
49
-
50
-
51
-
52
-
53
-
54
-
55
-
56
-
57
-
58
-
59
-
60
-
61
-
62
-
63
-
64
-
65
-
66
-
67
-
68
-
69
-
70
-
71
-
72
-
73
-
 74
74 -
 75
75 -
 76
76 -
 77
77 -
 78
78 -
 79
79 -
 80
80 -
 81
81 -
 82
82 -
 83
83 -
 84
84 -
 85
85 -
 86
86 -
 87
87
 |
 |

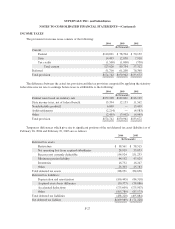
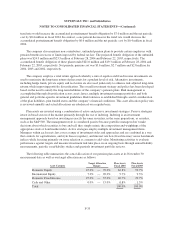
UNAUDITED QUARTERLY FINANCIAL INFORMATION
(In thousands, except per share data)
Unaudited quarterly financial information for SUPERVALU INC. and subsidiaries is as follows:
Fiscal Year Ended February 28, 2004
First
(16 wks)
Second
(12 wks)
Third
(12 wks)
Fourth
(13 wks)
Year
(53 wks)
Net sales $5,836,287 $4,590,650 $4,738,983 $5,043,759 $20,209,679
Gross profit $ 800,746 $ 637,248 $ 645,630 $ 753,626 $ 2,837,250
Net earnings $ 73,670 $ 62,232 $ 48,616 $ 95,620 $ 280,138
Net earnings per common share—diluted $ 0.55 $ 0.46 $ 0.36 $ 0.70 $ 2.07
Dividends declared per common share $ 0.1425 $ 0.1450 $ 0.1450 $ 0.1450 $ 0.5775
Weighted average shares—diluted 134,118 135,546 135,862 136,548 135,418
Fiscal Year Ended February 22, 2003
First
(16 wks)
Second
(12 wks)
Third
(12 wks)
Fourth
(12 wks)
Year
(52 wks)
Net sales $5,654,424 $4,339,579 $4,553,443 $4,612,922 $19,160,368
Gross profit $ 756,956 $ 591,669 $ 596,343 $ 648,003 $ 2,592,971
Net earnings $ 77,155 $ 58,807 $ 57,137 $ 63,943 $ 257,042
Net earnings per common share—diluted $ 0.57 $ 0.44 $ 0.43 $ 0.48 $ 1.91
Dividends declared per common share $ 0.1400 $ 0.1425 $ 0.1425 $ 0.1425 $ 0.5675
Weighted average shares—diluted 136,139 134,927 134,087 133,934 134,877
Note: Fiscal 2004 net earnings include after-tax restructure and other items of $9.8 million or $0.07 per
diluted share. Fiscal 2003 net earnings include after-tax restructure charges of $1.8 million or $0.01 per diluted
share.
F-37