Albertsons 2004 Annual Report Download - page 11
Download and view the complete annual report
Please find page 11 of the 2004 Albertsons annual report below. You can navigate through the pages in the report by either clicking on the pages listed below, or by using the keyword search tool below to find specific information within the annual report.-
 1
1 -
 2
2 -
 3
3 -
 4
4 -
 5
5 -
 6
6 -
 7
7 -
 8
8 -
 9
9 -
 10
10 -
 11
11 -
 12
12 -
 13
13 -
 14
14 -
 15
15 -
 16
16 -
 17
17 -
 18
18 -
 19
19 -
 20
20 -
 21
21 -
 22
22 -
23
-
24
-
25
-
26
-
27
-
28
-
29
-
30
-
31
-
32
-
33
-
34
-
35
-
36
-
37
-
38
-
39
-
40
-
41
-
42
-
43
-
44
-
45
-
46
-
47
-
48
-
49
-
50
-
51
-
52
-
53
-
54
-
55
-
56
-
57
-
58
-
59
-
60
-
61
-
62
-
63
-
64
-
65
-
66
-
67
-
68
-
69
-
70
-
71
-
72
-
73
-
74
-
75
-
76
-
77
-
78
-
79
-
80
-
81
-
82
-
83
-
84
-
85
-
86
-
87
 |
 |

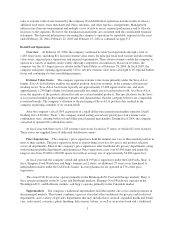
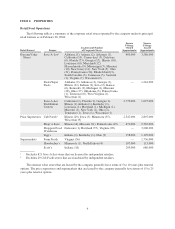
ITEM 2. PROPERTIES
Retail Food Operations
The following table is a summary of the corporate retail stores operated by the company under its principal
retail formats as of February 28, 2004:
Retail Format Banner
Location and Number
of Corporate Stores
Square
Footage
Owned
(Approximate)
Square
Footage
Leased
(Approximate)
ExtremeValue
Stores
Save-A-Lot1Alabama (1), Arizona (2), Arkansas (1),
California (19), Connecticut (5), Delaware
(6), Florida (73), Georgia (17), Illinois (18),
Louisiana (10), Maryland (12),
Massachusetts (9), Mississippi (5), Missouri
(10), New Jersey (11), New York (5), Ohio
(31), Pennsylvania (24), Rhode Island (3),
South Carolina (3), Tennessee (5), Vermont
(1), Virginia (7), Wisconsin (2)
665,000 3,586,000
Deals/Super
Deals
Alabama (2), Arkansas (4), Georgia (3),
Illinois (21), Indiana (9), Iowa (2), Kansas
(6), Kentucky (9), Michigan (1), Missouri
(28), Ohio (27), Oklahoma (3), Pennsylvania
(1), Tennessee (6), West Virginia (1),
Wisconsin (1)
— 1,244,000
Save-A-Lot
Distribution
Centers
California (1), Florida (1), Georgia (1),
Illinois (1), Indiana (1), Kentucky (1),
Louisiana (1), Maryland (1), Michigan (1),
Missouri (1), New York (1), Ohio (2),
Tennessee (1), Texas (1), Wisconsin (1)
2,779,000 1,697,000
Price Superstores Cub Foods2Illinois (29), Iowa (3), Minnesota (35),
Wisconsin (9)
2,547,000 2,807,000
Shop ’n Save Illinois (14), Missouri (21),Pennsylvania (19) 471,000 2,362,000
Shoppers Food
Warehouse
Delaware (1) Maryland (37), Virginia (20) — 3,206,000
bigg’s Indiana (1), Kentucky (1), Ohio (9) 158,000 1,129,000
Supermarkets Farm Fresh Virginia (36) — 1,736,000
Hornbacher’s Minnesota (1), North Dakota (4) 107,000 113,000
Scott’s Indiana (18) 293,000 680,000
1Excludes 821 Save-A-Lot stores that are licensed by independent retailers.
2Excludes 29 Cub Foods stores that are franchised by independent retailers.
The extreme value stores that are leased by the company generally have terms of 5 to 10 years plus renewal
options. The price superstores and supermarkets that are leased by the company generally have terms of 15 to 25
years plus renewal options.
6