Albertsons 2004 Annual Report Download - page 49
Download and view the complete annual report
Please find page 49 of the 2004 Albertsons annual report below. You can navigate through the pages in the report by either clicking on the pages listed below, or by using the keyword search tool below to find specific information within the annual report.-
 1
1 -
2
-
3
-
4
-
5
-
6
-
7
-
8
-
9
-
10
-
11
-
12
-
13
-
14
-
15
-
16
-
17
-
18
-
19
-
20
-
21
-
22
-
23
-
24
-
25
-
26
-
27
-
28
-
29
-
30
-
31
-
32
-
33
-
34
-
35
-
36
-
37
-
38
-
 39
39 -
 40
40 -
 41
41 -
 42
42 -
 43
43 -
 44
44 -
 45
45 -
 46
46 -
 47
47 -
 48
48 -
 49
49 -
 50
50 -
 51
51 -
 52
52 -
 53
53 -
 54
54 -
 55
55 -
 56
56 -
 57
57 -
 58
58 -
 59
59 -
60
-
61
-
62
-
63
-
64
-
65
-
66
-
67
-
68
-
69
-
70
-
71
-
72
-
73
-
74
-
75
-
76
-
77
-
78
-
79
-
80
-
81
-
82
-
83
-
84
-
85
-
86
-
87
 |
 |

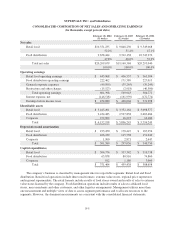
SUPERVALU INC. and Subsidiaries
FIVE YEAR FINANCIAL AND OPERATING SUMMARY
2004 2003 2002 2001 2000(b)
Statement of Earnings
Data (a)
Net sales $20,209,679 $19,160,368 $20,293,040 $22,520,384 $19,675,782
Cost of sales 17,372,429 16,567,397 17,704,197 19,976,436 17,450,060
Selling and administrative
expenses 2,220,329 2,020,110 2,037,771 2,042,259 1,705,003
Gain on sale of Hazelwood
Farms Bakeries ————163,662
Restructure and other charges 15,523 2,918 46,300 171,264 103,596
Operating earnings 601,398 569,943 504,772 330,425 580,785
Interest, net 146,518 161,939 172,774 190,835 135,392
Earnings before taxes 454,880 408,004 331,998 139,590 445,393
Provision for income taxes 174,742 150,962 133,672 66,720 203,703
Net earnings 280,138 257,042 198,326 72,870 241,690
Net earnings per common
share—diluted 2.07 1.91 1.48 0.55 1.86
Balance Sheet Data (a)
Inventories (FIFO) (c) $ 1,214,122 $ 1,194,791 $ 1,178,817 $ 1,477,180 $ 1,622,151
Working capital (c) 300,899 288,572 36,031 (125,408) (197,599)
Net property, plant and
equipment 2,134,436 2,220,850 2,208,633 2,232,794 2,168,210
Total assets 6,152,938 5,896,245 5,796,249 6,343,152 6,493,292
Long-term debt (d) 1,633,721 2,019,658 1,875,873 2,008,474 1,953,741
Stockholders’ equity 2,209,574 2,009,240 1,899,138 1,783,149 1,820,228
Other Statistics (a)
Net earnings as a percent of net
sales 1.39% 1.34% 0.98% 0.32% 1.23%
Return on average
stockholders’ equity 13.29% 12.97% 10.70% 3.96% 14.80%
Book value per common share $ 16.40 $ 15.03 $ 14.29 $ 13.47 $ 13.52
Current ratio (c) 1.16:1 1.19:1 1.02:1 0.95:1 0.92:1
Debt to capital ratio (e) 46.7% 51.8% 54.3% 59.7% 60.0%
Dividends declared per
common share $ 0.57¾ $ 0.56¾ $ 0.55¾ $ 0.54¾ $ 0.53¾
Weighted average common
shares outstanding—diluted 135,418 134,877 133,978 132,829 130,090
Depreciation and amortization $ 301,589 $ 297,056 $ 340,750 $ 343,779 $ 277,062
Capital expenditures (f) $ 371,464 $ 439,438 $ 388,658 $ 511,673 $ 539,264
Net cash provided by operating
activities $ 832,206 $ 587,604 $ 692,542 $ 611,804 $ 345,230
Net cash used in investing
activities $ (256,984) $ (334,717) $ (224,707) $ (357,179) $ (516,796)
Net cash used in financing
activities $ (312,454) $ (235,870) $ (466,060) $ (255,149) $ (174,878)
F-2