Albertsons 2004 Annual Report Download - page 27
Download and view the complete annual report
Please find page 27 of the 2004 Albertsons annual report below. You can navigate through the pages in the report by either clicking on the pages listed below, or by using the keyword search tool below to find specific information within the annual report.-
 1
1 -
2
-
3
-
4
-
5
-
6
-
7
-
8
-
9
-
10
-
11
-
12
-
13
-
14
-
15
-
16
-
 17
17 -
 18
18 -
 19
19 -
 20
20 -
 21
21 -
 22
22 -
 23
23 -
 24
24 -
 25
25 -
 26
26 -
 27
27 -
 28
28 -
 29
29 -
 30
30 -
 31
31 -
 32
32 -
 33
33 -
 34
34 -
 35
35 -
 36
36 -
 37
37 -
38
-
39
-
40
-
41
-
42
-
43
-
44
-
45
-
46
-
47
-
48
-
49
-
50
-
51
-
52
-
53
-
54
-
55
-
56
-
57
-
58
-
59
-
60
-
61
-
62
-
63
-
64
-
65
-
66
-
67
-
68
-
69
-
70
-
71
-
72
-
73
-
74
-
75
-
76
-
77
-
78
-
79
-
80
-
81
-
82
-
83
-
84
-
85
-
86
-
87
 |
 |
determined primarily based on valuation studies performed by the company, which utilize a discounted cash flow
methodology. Valuation analysis requires significant judgments and estimates to be made by management. The
company’s estimates could be materially impacted by factors such as competitive forces, customer behaviors,
changes in growth trends and specific industry conditions.
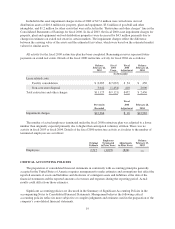
LIQUIDITY AND CAPITAL RESOURCES
Net cash provided by operating activities was $832.2 million, $587.6 million, and $692.5 million in fiscal
2004, 2003 and 2002, respectively. The increase in cash from operating activities in fiscal 2004 from fiscal 2003
is primarily related to changes in assets and liabilities reflecting changes in working capital including timing
differences for tax payments and increases in the minimum pension liability.
Net cash used in investing activities was $257.0 million, $334.7 million, and $224.7 million in fiscal 2004,
2003, and 2002, respectively. Fiscal 2004 investing activities primarily reflect capital spending to fund retail
store expansion, store remodeling, extreme value distribution facilities and technology enhancements. Fiscal
2003 investing activities primarily reflect capital spending to fund retail store expansion, including the
acquisition of Deals, store remodeling and technology enhancements.
Net cash used in financing activities was $312.5 million, $235.9 million, and $466.1 million in fiscal 2004,
2003 and 2002, respectively. Fiscal 2004 financing activities primarily reflect the early redemption of
$100.0 million of the company’s 8.875% notes due in 2022 at the redemption price of 103.956% of the principal
amount of the notes, the net reduction in notes payable of $80.0 million, the payment of dividends of
$77.0 million and the purchase of treasury shares of $14.6 million. Fiscal 2003 financing activities primarily
reflect the issuance of $300.0 million 10-year 7.50% Senior Notes, completed in May 2002, the early redemption
of $173.0 million of the company’s 9.75% Senior Notes due in fiscal 2005 at the redemption price of 102.4375%
of the principal amount of the Senior Notes, the retirement of a $300 million 7.80% notes that matured in
November 2002, the payment of dividends of $75.6 million and the purchase of treasury shares of $42.2 million.
On April 1, 2004, the company completed the sale of its minority ownership interest in WinCo Foods, Inc.,
a privately-held regional grocery chain that operates stores in Idaho, Oregon, Nevada, Washington and
California. The company received after-tax proceeds of approximately $150 million on the sale of WinCo. See
Subsequent Events note on page F-36 of the accompanying Notes to Consolidated Financial Statements. The
impact of this transaction to fiscal 2005 is estimated to reduce net earnings by approximately $0.10 per share,
reflecting the elimination of WinCo’s non-cash equity earnings and increase net earnings by approximately
$0.50 per share for the one-time after-tax gain on the sale.
Management expects that the company will continue to replenish operating assets with internally generated
funds. There can be no assurance, however, that the company’s business will continue to generate cash flow at
current levels. The company will continue to obtain short-term financing from its revolving credit agreement
with various financial institutions, as well as through its accounts receivable securitization program. Long-term
financing will be maintained through existing and new debt issuances. The company’s short-term and long-term
financing abilities are believed to be adequate as a supplement to internally generated cash flows to fund its
capital expenditures and acquisitions as opportunities arise. Maturities of debt issued will depend on
management’s views with respect to the relative attractiveness of interest rates at the time of issuance and other
debt maturities.
As of February 28, 2004, the company’s current portion of outstanding debt including obligations under
capital leases was $305.9 million. The company had no outstanding borrowings under its unsecured $650.0
million revolving credit facility. Letters of credit outstanding under the credit facility were $120.1 million and the
unused available credit under the facility was $529.9 million. The Company also had $25.6 million of
outstanding letters of credit issued under separate agreements with financial institutions.
22