Albertsons 2004 Annual Report Download - page 82
Download and view the complete annual report
Please find page 82 of the 2004 Albertsons annual report below. You can navigate through the pages in the report by either clicking on the pages listed below, or by using the keyword search tool below to find specific information within the annual report.-
 1
1 -
2
-
3
-
4
-
5
-
6
-
7
-
8
-
9
-
10
-
11
-
12
-
13
-
14
-
15
-
16
-
17
-
18
-
19
-
20
-
21
-
22
-
23
-
24
-
25
-
26
-
27
-
28
-
29
-
30
-
31
-
32
-
33
-
34
-
35
-
36
-
37
-
38
-
39
-
40
-
41
-
42
-
43
-
44
-
45
-
46
-
47
-
48
-
49
-
50
-
51
-
52
-
53
-
54
-
55
-
56
-
57
-
58
-
59
-
60
-
61
-
62
-
63
-
64
-
65
-
66
-
67
-
68
-
69
-
70
-
71
-
 72
72 -
 73
73 -
 74
74 -
 75
75 -
 76
76 -
 77
77 -
 78
78 -
 79
79 -
 80
80 -
 81
81 -
 82
82 -
 83
83 -
 84
84 -
 85
85 -
 86
86 -
 87
87
 |
 |

SUPERVALU INC. and Subsidiaries
NOTES TO CONSOLIDATED FINANCIAL STATEMENTS—(Continued)
trend rate would increase the accumulated postretirement benefit obligation by $7.0 million and the net periodic
cost by $0.4 million in fiscal 2004. In contrast, a one percent decrease in the trend rate would decrease the
accumulated postretirement benefit obligation by $6.6 million and the net periodic cost by $0.4 million in fiscal
2004.
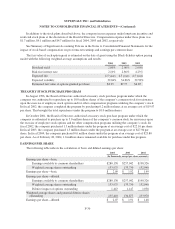
The company also maintains non-contributory, unfunded pension plans to provide certain employees with
pension benefits in excess of limits imposed by federal tax law. The projected benefit obligation of the unfunded
plans was $24.9 million and $23.5 million at February 28, 2004 and February 22, 2003, respectively. The
accumulated benefit obligation of these plans totaled $21.0 million and $19.3 million at February 28, 2004 and
February 22, 2003, respectively. Net periodic pension cost was $3.6 million, $2.7 million and $2.8 million for
2004, 2003 and 2002, respectively.
The company employs a total return approach whereby a mix of equities and fixed income investments are
used to maximize the long-term return of plan assets for a prudent level of risk. Alternative investments,
including hedge funds, private equity and real estate are also used judiciously to enhance risk adjusted long-term
returns while improving portfolio diversification. The overall investment strategy and policy has been developed
based on the need to satisfy the long-term liabilities of the company’s pension plans. Risk management is
accomplished through diversification across asset classes, multiple investment manager portfolios and both
general and portfolio-specific investment guidelines. Risk tolerance is established through careful consideration
of the plan liabilities, plan funded status and the company’s financial conditions. This asset allocation policy mix
is reviewed annually and actual allocations are rebalanced on a regular basis.
Plan assets are invested using a combination of active and passive investment strategies. Passive strategies
invest in broad sectors of the market primarily through the use of indexing. Indexing is an investment
management approach based on investing in exactly the same securities, in the same proportions, as an index,
such as the S&P 500. The management style is considered passive because portfolio managers don’t make
decisions about which securities to buy and sell, they simply mimic the composition and weightings of the
appropriate stock or bond market index. Active strategies employ multiple investment management firms.
Managers within each asset class cover a range of investment styles and approaches and are combined in a way
that controls for capitalization, and style biases (equities), and interest rate bets (fixed income) versus benchmark
indices while focusing primarily on issue selection as a means to add value. Monitoring activities to evaluate
performance against targets and measure investment risk take place on an ongoing basis through annual liability
measurements, periodic asset/liability studies and quarterly investment portfolio reviews.
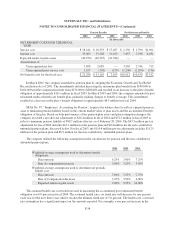
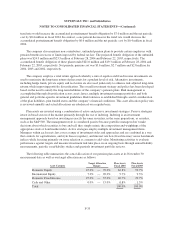
The following table summarizes the actual allocation of our pension plan assets at its November 30
measurement date as well as our target allocation are as follows:
Asset Category
Target Allocation
Ranges
Plan Assets
Fiscal 2004
Plan Assets
Fiscal 2003
Domestic Equity 45.0% — 70.0% 62.8% 59.7%
International Equity 7.0% — 20.0% 9.7% 9.3%
Domestic Fixed Income 25.0% — 35.0% 26.7% 29.7%
Cash and Other 0.0% — 15.0% 0.8% 1.3%
Total 100.0% 100.0%
F-35