Albertsons 2004 Annual Report Download - page 56
Download and view the complete annual report
Please find page 56 of the 2004 Albertsons annual report below. You can navigate through the pages in the report by either clicking on the pages listed below, or by using the keyword search tool below to find specific information within the annual report.-
 1
1 -
2
-
3
-
4
-
5
-
6
-
7
-
8
-
9
-
10
-
11
-
12
-
13
-
14
-
15
-
16
-
17
-
18
-
19
-
20
-
21
-
22
-
23
-
24
-
25
-
26
-
27
-
28
-
29
-
30
-
31
-
32
-
33
-
34
-
35
-
36
-
37
-
38
-
39
-
40
-
41
-
42
-
43
-
44
-
45
-
 46
46 -
 47
47 -
 48
48 -
 49
49 -
 50
50 -
 51
51 -
 52
52 -
 53
53 -
 54
54 -
 55
55 -
 56
56 -
 57
57 -
 58
58 -
 59
59 -
 60
60 -
 61
61 -
 62
62 -
 63
63 -
 64
64 -
 65
65 -
 66
66 -
67
-
68
-
69
-
70
-
71
-
72
-
73
-
74
-
75
-
76
-
77
-
78
-
79
-
80
-
81
-
82
-
83
-
84
-
85
-
86
-
87
 |
 |

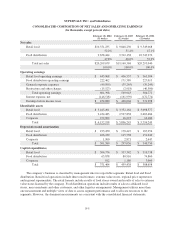
SUPERVALU INC. and Subsidiaries
CONSOLIDATED STATEMENTS OF CASH FLOWS
(In thousands)
February 28,
2004
(53 weeks)
February 22,
2003
(52 weeks)
February 23,
2002
(52 weeks)
Cash flows from operating activities
Net earnings $ 280,138 $ 257,042 $ 198,326
Adjustments to reconcile net earnings to net cash provided by operating
activities:
Depreciation and amortization 301,589 297,056 340,750
LIFO expense 4,734 4,741 143
Provision for losses on receivables 10,479 15,719 19,898
(Gain) loss on sale of property, plant and equipment (1,802) (5,564) 4,649
Restructure and other charges 15,523 2,918 46,300
Deferred income taxes 38,761 14,184 76,360
Equity in earnings of unconsolidated subsidiaries (39,215) (39,724) (29,156)
Other adjustments, net 4,339 3,675 (1,228)
Changes in assets and liabilities
Receivables 23,407 (46,890) 120,613
Inventories (19,331) (15,974) 298,150
Accounts payable 7,322 111,811 (386,504)
Income taxes currently payable 82,781 22,707 (7,146)
Other assets and liabilities 123,481 (34,097) 11,387
Net cash provided by operating activities 832,206 587,604 692,542
Cash flows from investing activities
Additions to long-term notes receivable (17,955) (61,963) (37,372)
Proceeds received on long-term notes receivable 32,575 57,869 47,794
Proceeds from sale of assets 56,552 65,986 57,798
Purchases of property, plant and equipment (328,156) (396,609) (292,927)
Net cash used in investing activities (256,984) (334,717) (224,707)
Cash flows from financing activities
Net (reduction) issuance of notes payable (80,000) 56,000 (551,574)
Proceeds from issuance of long-term debt — 296,535 218,014
Repayment of long-term debt (131,063) (472,448) (19,863)
Reduction of obligations under capital leases (32,884) (29,767) (25,988)
Dividends paid (77,035) (75,648) (74,024)
Net proceeds from the sale of common stock under option plans 23,127 31,617 19,458
Payment for purchase of treasury shares (14,599) (42,159) (32,083)
Net cash used in financing activities (312,454) (235,870) (466,060)
Net increase in cash and cash equivalents 262,768 17,017 1,775
Cash and cash equivalents at beginning of year 29,188 12,171 10,396
Cash and cash equivalents at end of year $ 291,956 $ 29,188 $ 12,171
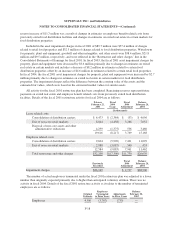
SUPPLEMENTAL CASH FLOW INFORMATION
The company’s non-cash activities were as follows:
Leased asset additions and related obligations $ 43,308 $ 42,829 $ 95,731
Minimum pension liability, net of deferred taxes of $17.1 million and $47.1
million in 2004 and 2003 $ 26,404 $ 72,328 $ —
Interest and income taxes paid:
Interest paid (net of amount capitalized) $143,088 $171,089 $184,719
Income taxes paid (net of refunds) $ 29,081 $ 48,787 $ 60,611
See notes to consolidated financial statements.
F-9