Albertsons 2004 Annual Report Download - page 21
Download and view the complete annual report
Please find page 21 of the 2004 Albertsons annual report below. You can navigate through the pages in the report by either clicking on the pages listed below, or by using the keyword search tool below to find specific information within the annual report.-
 1
1 -
2
-
3
-
4
-
5
-
6
-
7
-
8
-
9
-
10
-
 11
11 -
 12
12 -
 13
13 -
 14
14 -
 15
15 -
 16
16 -
 17
17 -
 18
18 -
 19
19 -
 20
20 -
 21
21 -
 22
22 -
 23
23 -
 24
24 -
 25
25 -
 26
26 -
 27
27 -
 28
28 -
 29
29 -
 30
30 -
 31
31 -
32
-
33
-
34
-
35
-
36
-
37
-
38
-
39
-
40
-
41
-
42
-
43
-
44
-
45
-
46
-
47
-
48
-
49
-
50
-
51
-
52
-
53
-
54
-
55
-
56
-
57
-
58
-
59
-
60
-
61
-
62
-
63
-
64
-
65
-
66
-
67
-
68
-
69
-
70
-
71
-
72
-
73
-
74
-
75
-
76
-
77
-
78
-
79
-
80
-
81
-
82
-
83
-
84
-
85
-
86
-
87
 |
 |
Fiscal 2004 net cash outflows relating to all restructure plans were approximately $20 million. Remaining
future net cash outflows primarily relate to expected net future payments on exited real estate and employee
related costs, net of after-tax proceeds from the sale of owned properties. Cash outflows will be funded by cash
from operations.
Restructure 2002
In fiscal 2002, the company identified additional efforts that would allow it to extend its food distribution
efficiency program that began early in fiscal 2001. The additional food distribution efficiency initiatives
identified resulted in pre-tax restructure charges of $16.3 million, primarily related to personnel reductions in
administrative and transportation functions. Management began the initiatives in fiscal 2003 and the majority of
these actions were completed by the end of fiscal 2003.
In fiscal 2003, the fiscal 2002 restructure charges were decreased by $3.6 million, including a decrease of
$1.4 million due to lower than anticipated lease related costs in transportation efficiency initiatives and a
decrease of $2.2 million in employee related costs due to lower than anticipated severance costs.
In fiscal 2004, the fiscal 2002 restructure charges were increased by $0.6 million due to higher than
anticipated severance costs for certain employees.
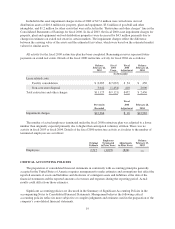
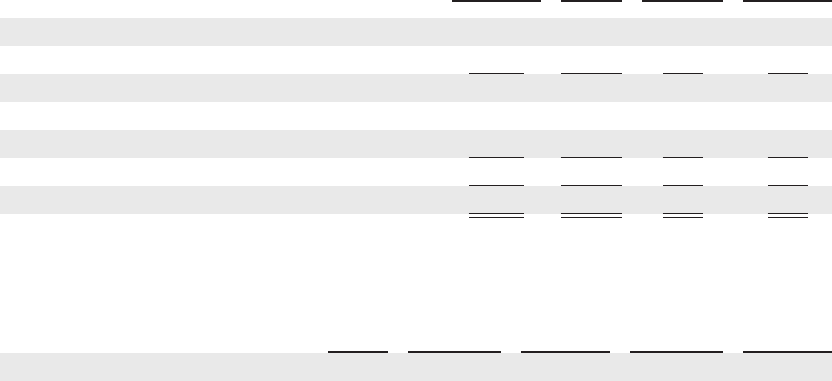
Remaining reserves for the fiscal 2002 restructure plan represent future lease payments. Details of the fiscal
2002 restructure activity for fiscal 2004 are as follows:
Balance
February 22,
2003
Fiscal
2004
Usage
Fiscal 2004
Adjustment
Balance
February 28,
2004
(In thousands)
Lease related costs:
Transportation efficiency initiatives $1,054 $ (816) $ (43) $195
1,054 (816) (43) 195
Employee related costs:
Administrative realignment 2,390 (3,019) 629 —
2,390 (3,019) 629 —
Total restructure charges $3,444 $(3,835) $586 $195
Details of the fiscal 2002 restructure activity as it relates to the number of terminated employees are as
follows:
Original
Estimate
Employees
Terminated
in Fiscal 2003
Balance
February 22,
2003
Employees
Terminated
in Fiscal 2004
Balance
February 28,
2004
Employees 800 (650) 150 (150) —
Restructure 2001
In fiscal 2001, the company completed a strategic review that identified certain assets that did not meet
return objectives, provide long-term strategic opportunities or justify additional capital investments. This review
process culminated in the company recording pre-tax restructure and other charges of $181.6 million, including
$89.7 million for asset impairment charges, $52.1 million for lease subsidies, lease cancellation fees, future
payments on exited real estate and guarantee obligations and $39.8 million for severance and employee related
costs.
In fiscal 2002, the fiscal 2001 restructure and other charges were increased by $17.8 million as a result of
changes in estimates primarily due to the softening real estate market, including $19.1 million for increased lease
liabilities in exiting the non-core retail markets and the disposal of non-core assets, offset by a net decrease of
$1.3 million in restructure reserves for the consolidation of distribution centers.
16