Albertsons 2004 Annual Report Download - page 77
Download and view the complete annual report
Please find page 77 of the 2004 Albertsons annual report below. You can navigate through the pages in the report by either clicking on the pages listed below, or by using the keyword search tool below to find specific information within the annual report.-
 1
1 -
2
-
3
-
4
-
5
-
6
-
7
-
8
-
9
-
10
-
11
-
12
-
13
-
14
-
15
-
16
-
17
-
18
-
19
-
20
-
21
-
22
-
23
-
24
-
25
-
26
-
27
-
28
-
29
-
30
-
31
-
32
-
33
-
34
-
35
-
36
-
37
-
38
-
39
-
40
-
41
-
42
-
43
-
44
-
45
-
46
-
47
-
48
-
49
-
50
-
51
-
52
-
53
-
54
-
55
-
56
-
57
-
58
-
59
-
60
-
61
-
62
-
63
-
64
-
65
-
66
-
 67
67 -
 68
68 -
 69
69 -
 70
70 -
 71
71 -
 72
72 -
 73
73 -
 74
74 -
 75
75 -
 76
76 -
 77
77 -
 78
78 -
 79
79 -
 80
80 -
 81
81 -
 82
82 -
 83
83 -
 84
84 -
 85
85 -
 86
86 -
 87
87
 |
 |

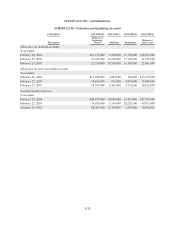
SUPERVALU INC. and Subsidiaries
NOTES TO CONSOLIDATED FINANCIAL STATEMENTS—(Continued)
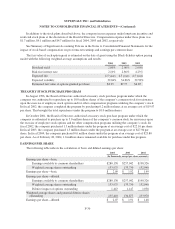
In addition to the stock plans described above, the company incurs expenses under long-term incentive and
restricted stock plans at the discretion of the Board of Directors. Compensation expense under these plans was
$1.7 million, $4.1 million and $4.7 million for fiscal 2004, 2003 and 2002, respectively.
See Summary of Significant Accounting Policies in the Notes to Consolidated Financial Statements for the
impact of stock based compensation on pro forma net earnings and earnings per common share.
The fair value of each option grant is estimated on the date of grant using the Black-Scholes option pricing
model with the following weighted-average assumptions and results:
2004 2003 2002
Dividend yield 2.00% 2.00% 2.00%
Risk free interest rate 2.10% 2.86% 4.23%
Expected life 4.5 years 4.5 years 4.5 years
Expected volatility 32.04% 34.66% 32.50%
Estimated fair value of options granted per share $4.25 $7.77 $4.85
TREASURY STOCK PURCHASE PROGRAM
In August 1996, the Board of Directors authorized a treasury stock purchase program under which the
company was authorized to repurchase up to 10.0 million shares of the company’s common stock for reissuance
upon the exercise of employee stock options and for other compensation programs utilizing the company’s stock.
In fiscal 2002, the company completed the program by purchasing 0.2 million shares at an average cost of $19.97
per share. This brought the total repurchases under the program to 10.0 million shares.
In October 2001, the Board of Directors authorized a treasury stock purchase program under which the
company is authorized to purchase up to 5.0 million shares of the company’s common stock for reissuance upon
the exercise of employee stock options and for other compensation programs utilizing the company’s stock. In
fiscal 2002, the company purchased 1.3 million shares under the program at an average cost of $22.16 per share.
In fiscal 2003, the company purchased 1.5 million shares under the program at an average cost of $27.94 per
share. In fiscal 2004, the company purchased 0.6 million shares under the program at an average cost of $23.80
per share. As of February 28, 2004, 1.6 million shares remained available for purchase under this program.
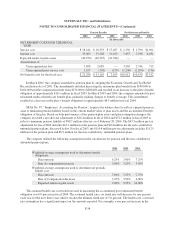
EARNINGS PER SHARE
The following table reflects the calculation of basic and diluted earnings per share:
2004 2003 2002
(In thousands, except per share amounts)
Earnings per share—basic
Earnings available to common shareholders $280,138 $257,042 $198,326
Weighted average shares outstanding 133,975 133,730 132,940
Earnings per share—basic $ 2.09 $ 1.92 $ 1.49
Earnings per share—diluted
Earnings available to common shareholders $280,138 $257,042 $198,326
Weighted average shares outstanding 133,975 133,730 132,940
Dilutive impact of options outstanding 1,443 1,147 1,038
Weighted average shares and potential dilutive shares
outstanding 135,418 134,877 133,978
Earnings per share—diluted $ 2.07 $ 1.91 $ 1.48
F-30