Albertsons 2004 Annual Report Download - page 17
Download and view the complete annual report
Please find page 17 of the 2004 Albertsons annual report below. You can navigate through the pages in the report by either clicking on the pages listed below, or by using the keyword search tool below to find specific information within the annual report.
All the above factors will continue to impact our industry and our company in fiscal 2005.
We believe we can be successful against this industry backdrop with our regional retail formats that focus
on local execution, merchandising, and consumer knowledge. In addition, our operations benefit from our
efficient and low-cost supply chain and economies of scale as we leverage our retail and distribution operations.
Save-A-Lot, our extreme value format, has nationwide potential, and currently operates in 37 states. After our
fiscal 2003 acquisition of Deals, we tested in fiscal 2004 several new prototypes of an extreme value combination
store, offering both food and dollar general merchandise. We are pleased with the performance of the new
prototypes and the majority of our new extreme value food stores will be a type of combination store in the
future. We plan to expand regional retail banner square footage through selective new store growth in key
markets where we have significant market share. In addition, we will supplement regional retail store growth
with continued focus on remodel activities. Given the life cycle maturity of our distribution business with its
inherent attrition rate, future growth in food distribution will be modest and primarily achieved through serving
new independent customers, net growth from existing customers and further consolidation opportunities. We will
remain committed to streamlining our operations and improving our return on invested capital through a variety
of initiatives.
RESULTS OF OPERATIONS
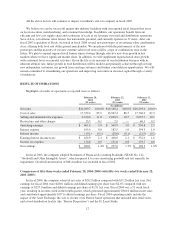
Highlights of results of operations as reported were as follows:
February 28,
2004
(53 weeks)
February 22,
2003
(52 weeks)
February 23,
2002
(52 weeks)
(In millions)
Net sales $20,209.7 100.0% $19,160.4 100.0% $20,293.0 100.0%
Cost of sales 17,372.4 85.9 16,567.4 86.5 17,704.2 87.2
Selling and administrative expenses 2,220.4 11.0 2,020.2 10.5 2,037.7 10.1
Restructure and other charges 15.5 0.1 2.9 — 46.3 0.2
Operating earnings $ 601.4 3.0 $ 569.9 3.0 $ 504.8 2.5
Interest expense 165.6 0.8 182.5 1.0 194.3 1.0
Interest income (19.1) (0.1) (20.6) (0.1) (21.5) (0.1)
Earnings before income taxes $ 454.9 2.3 $ 408.0 2.1 $ 332.0 1.6
Income tax expense 174.8 0.9 151.0 0.8 133.7 0.6
Net earnings $ 280.1 1.4% $ 257.0 1.3% $ 198.3 1.0%
In fiscal 2003, the company adopted Statement of Financial Accounting Standards (SFAS) No. 142,
“Goodwill and Other Intangible Assets”, which required it to cease amortizing goodwill and test annually for
impairment. Goodwill amortization of $48.4 million was included in fiscal 2002.
Comparison of fifty-three weeks ended February 28, 2004 (2004) with fifty-two weeks ended February 22,
2003 (2003):
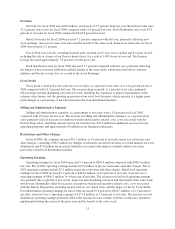
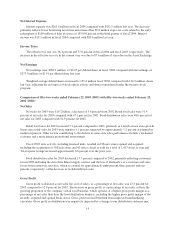
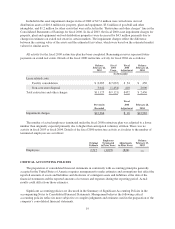
In fiscal 2004, the company achieved net sales of $20.2 billion compared with $19.2 billion last year. Net
earnings for fiscal 2004 were $280.1 million and diluted earnings per share were $2.07 compared with net
earnings of $257.0 million and diluted earnings per share of $1.91 last year. Fiscal 2004 was a 53 week fiscal
year, resulting in an extra week in the fourth quarter, which generated approximately $360.0 million in net sales
and contributed approximately $.07 to diluted earnings per share. Fiscal 2004 operating results include the
impact of the Asset Exchange, the sale or closure of its Denver based operations that included nine retail stores
and a food distribution facility (the “Denver Disposition”) and the St. Louis Strike.
12


