Albertsons 2004 Annual Report Download - page 22
Download and view the complete annual report
Please find page 22 of the 2004 Albertsons annual report below. You can navigate through the pages in the report by either clicking on the pages listed below, or by using the keyword search tool below to find specific information within the annual report.-
 1
1 -
2
-
3
-
4
-
5
-
6
-
7
-
8
-
9
-
10
-
11
-
 12
12 -
 13
13 -
 14
14 -
 15
15 -
 16
16 -
 17
17 -
 18
18 -
 19
19 -
 20
20 -
 21
21 -
 22
22 -
 23
23 -
 24
24 -
 25
25 -
 26
26 -
 27
27 -
 28
28 -
 29
29 -
 30
30 -
 31
31 -
 32
32 -
33
-
34
-
35
-
36
-
37
-
38
-
39
-
40
-
41
-
42
-
43
-
44
-
45
-
46
-
47
-
48
-
49
-
50
-
51
-
52
-
53
-
54
-
55
-
56
-
57
-
58
-
59
-
60
-
61
-
62
-
63
-
64
-
65
-
66
-
67
-
68
-
69
-
70
-
71
-
72
-
73
-
74
-
75
-
76
-
77
-
78
-
79
-
80
-
81
-
82
-
83
-
84
-
85
-
86
-
87
 |
 |
In fiscal 2003, the fiscal 2001 restructure and other charges were increased by $8.1 million, including an
$11.7 million increase to the restructure reserves offset by a decrease in asset impairment charges of $3.6 million.
The reserve increase of $11.7 million was a result of changes in estimates on exited real estate primarily due to
the continued softening of real estate marketed for sale, sublease or assignment in certain markets, including
approximately $5 million relating to the consolidation of distribution centers, $6 million relating to the exit of
non-core retail markets and $1.2 million in higher than anticipated employee related costs primarily in the exit of
non-core retail markets.
For fiscal 2004, the fiscal 2001 restructure and other charges were increased by $14.4 million, including an
$11.7 million increase to the restructure reserves and a $2.7 million increase in asset impairment charges. The
reserve increase of $11.7 million was a result of changes in estimates on employee benefit related costs from
previously exited food distribution facilities and changes in estimates on exited real estate in certain markets for
food distribution properties.
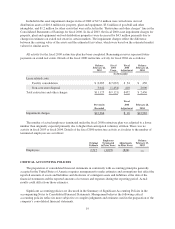
Included in the asset impairment charges in fiscal 2001 of $89.7 million were $57.4 million of charges
related to retail food properties and $32.3 million of charges related to food distribution properties. Writedowns
for property, plant and equipment, goodwill and other intangibles, and other assets were $58.4 million, $21.8
million and $9.5 million, respectively, and were reflected in the “Restructure and other charges” line in the
Consolidated Statements of Earnings for fiscal 2001. In fiscal 2003, the fiscal 2001 asset impairment charges for
property, plant and equipment were decreased by $3.6 million primarily due to changes in estimates on exited
real estate in certain markets and includes a decrease of $8.2 million in estimates related to certain food
distribution properties offset by an increase of $4.6 million in estimates related to certain retail food properties.
In fiscal 2004, the fiscal 2001 asset impairment charges for property, plant and equipment were increased by $2.7
million primarily due to changes in estimates on exited real estate in certain markets for food distribution
properties. The impairment charges reflect the difference between the carrying value of the assets and the
estimated fair values, which were based on the estimated market values for similar assets.
17