Albertsons 2004 Annual Report Download - page 52
Download and view the complete annual report
Please find page 52 of the 2004 Albertsons annual report below. You can navigate through the pages in the report by either clicking on the pages listed below, or by using the keyword search tool below to find specific information within the annual report.-
 1
1 -
2
-
3
-
4
-
5
-
6
-
7
-
8
-
9
-
10
-
11
-
12
-
13
-
14
-
15
-
16
-
17
-
18
-
19
-
20
-
21
-
22
-
23
-
24
-
25
-
26
-
27
-
28
-
29
-
30
-
31
-
32
-
33
-
34
-
35
-
36
-
37
-
38
-
39
-
40
-
41
-
 42
42 -
 43
43 -
 44
44 -
 45
45 -
 46
46 -
 47
47 -
 48
48 -
 49
49 -
 50
50 -
 51
51 -
 52
52 -
 53
53 -
 54
54 -
 55
55 -
 56
56 -
 57
57 -
 58
58 -
 59
59 -
 60
60 -
 61
61 -
 62
62 -
63
-
64
-
65
-
66
-
67
-
68
-
69
-
70
-
71
-
72
-
73
-
74
-
75
-
76
-
77
-
78
-
79
-
80
-
81
-
82
-
83
-
84
-
85
-
86
-
87
 |
 |

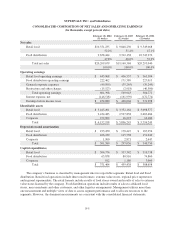
SUPERVALU INC. and Subsidiaries
CONSOLIDATED COMPOSITION OF NET SALES AND OPERATING EARNINGS
(In thousands, except percent data)
February 28, 2004
(53 weeks)
February 22, 2003
(52 weeks)
February 23, 2002
(52 weeks)
Net sales
Retail food $10,551,235 $ 9,848,230 $ 9,549,068
52.2% 51.4% 47.1%
Food distribution 9,658,444 9,312,138 10,743,972
47.8% 48.6% 52.9%
Total net sales $20,209,679 $19,160,368 $20,293,040
100.0% 100.0% 100.0%
Operating earnings
Retail food operating earnings $ 443,968 $ 436,537 $ 363,304
Food distribution operating earnings 222,462 171,589 227,013
General corporate expenses (49,509) (35,265) (39,245)
Restructure and other charges (15,523) (2,918) (46,300)
Total operating earnings 601,398 569,943 504,772
Interest expense, net (146,518) (161,939) (172,774)
Earnings before income taxes $ 454,880 $ 408,004 $ 331,998
Identifiable assets
Retail food $ 3,445,491 $ 3,352,164 $ 3,098,577
Food distribution 2,434,485 2,527,858 2,683,486
Corporate 272,962 16,223 14,186
Total $ 6,152,938 $ 5,896,245 $ 5,796,249
Depreciation and amortization
Retail food $ 193,450 $ 178,447 $ 187,254
Food distribution 106,239 115,738 151,049
Corporate 1,900 2,871 2,447
Total $ 301,589 $ 297,056 $ 340,750
Capital expenditures
Retail food $ 304,774 $ 357,342 $ 310,738
Food distribution 65,878 80,916 74,860
Corporate 812 1,180 3,060
Total $ 371,464 $ 439,438 $ 388,658
The company’s business is classified by management into two reportable segments: Retail food and Food
distribution. Retail food operations include three retail formats: extreme value stores, regional price superstores
and regional supermarkets. The retail formats include results of food stores owned and results of sales to extreme
value stores licensed by the company. Food distribution operations include results of sales to affiliated food
stores, mass merchants and other customers, and other logistics arrangements. Management utilizes more than
one measurement and multiple views of data to assess segment performance and to allocate resources to the
segments. However, the dominant measurements are consistent with the consolidated financial statements.
F-5