Albertsons 2004 Annual Report Download - page 60
Download and view the complete annual report
Please find page 60 of the 2004 Albertsons annual report below. You can navigate through the pages in the report by either clicking on the pages listed below, or by using the keyword search tool below to find specific information within the annual report.-
 1
1 -
2
-
3
-
4
-
5
-
6
-
7
-
8
-
9
-
10
-
11
-
12
-
13
-
14
-
15
-
16
-
17
-
18
-
19
-
20
-
21
-
22
-
23
-
24
-
25
-
26
-
27
-
28
-
29
-
30
-
31
-
32
-
33
-
34
-
35
-
36
-
37
-
38
-
39
-
40
-
41
-
42
-
43
-
44
-
45
-
46
-
47
-
48
-
49
-
 50
50 -
 51
51 -
 52
52 -
 53
53 -
 54
54 -
 55
55 -
 56
56 -
 57
57 -
 58
58 -
 59
59 -
 60
60 -
 61
61 -
 62
62 -
 63
63 -
 64
64 -
 65
65 -
 66
66 -
 67
67 -
 68
68 -
 69
69 -
 70
70 -
71
-
72
-
73
-
74
-
75
-
76
-
77
-
78
-
79
-
80
-
81
-
82
-
83
-
84
-
85
-
86
-
87
 |
 |

SUPERVALU INC. and Subsidiaries
NOTES TO CONSOLIDATED FINANCIAL STATEMENTS—(Continued)
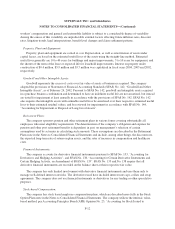
Employees,” for measuring the cost of compensation paid in company common stock. This method defines the
company’s cost as the excess of the stock’s market value at the time of the grant over the amount that the
employee is required to pay. In accordance with APB Opinion No. 25, no compensation expense was recognized
for options issued under the stock option plans in fiscal 2004, 2003 or 2002 as the exercise price of all options
granted was not less than 100 percent of fair market value of the common stock on the date of grant.
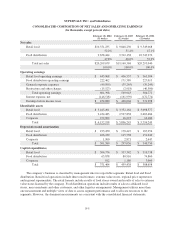
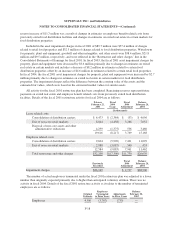
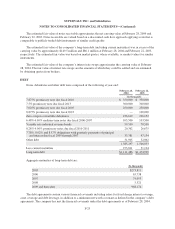
The following table illustrates the effect on net earnings and net earnings per share if the company had
applied the fair value recognition provisions of SFAS No. 123, “Accounting for Stock-Based Compensation,” as
amended by SFAS No. 148, “Accounting for Stock-Based Compensation,” to stock-based employee
compensation:
2004 2003 2002
(In thousands, except per share data)
Net earnings, as reported $280,138 $257,042 $198,326
Deduct: total stock-based employee compensation expense determined under
fair value based method for all awards, net of related tax effect (10,258) (9,528) (5,501)
Pro forma net earnings $269,880 $247,514 $192,825
Earnings per share—basic:
As reported $ 2.09 $ 1.92 $ 1.49
Pro forma $ 2.01 $ 1.85 $ 1.45
Earnings per share—diluted:
As reported $ 2.07 $ 1.91 $ 1.48
Pro forma $ 1.99 $ 1.84 $ 1.44
For more information on the method and assumptions used in determining the fair value of stock-based
compensation, see the Stock Option Plans note in the Notes to Consolidated Financial Statements.
Income Taxes:
The company provides for deferred income taxes during the year in accordance with SFAS No. 109,
“Accounting for Income Taxes”. Deferred income taxes represent future net tax effects resulting from temporary
differences between the financial statement and tax basis of assets and liabilities using enacted tax rates in effect
for the year in which the differences are expected to be settled or realized. The major temporary differences and
their net effect are shown in the Income Taxes note in the Notes to Consolidated Financial Statements.
Net Earnings Per Share (EPS):
EPS is calculated using income available to common shareholders divided by the weighted average number
of common shares outstanding during the year. Diluted EPS is similar to basic EPS except that the weighted
average number of common shares outstanding is after giving affect to dilutive stock options.
Comprehensive Income:
The company reports comprehensive income in accordance with SFAS No. 130, “Reporting Comprehensive
Income”. Comprehensive income refers to revenues, expenses, gains and losses that are not included in net
earnings but rather are recorded directly in the Consolidated Statements of Stockholders’ Equity.
F-13