Albertsons 2004 Annual Report Download - page 18
Download and view the complete annual report
Please find page 18 of the 2004 Albertsons annual report below. You can navigate through the pages in the report by either clicking on the pages listed below, or by using the keyword search tool below to find specific information within the annual report.-
 1
1 -
2
-
3
-
4
-
5
-
6
-
7
-
 8
8 -
 9
9 -
 10
10 -
 11
11 -
 12
12 -
 13
13 -
 14
14 -
 15
15 -
 16
16 -
 17
17 -
 18
18 -
 19
19 -
 20
20 -
 21
21 -
 22
22 -
 23
23 -
 24
24 -
 25
25 -
 26
26 -
 27
27 -
 28
28 -
29
-
30
-
31
-
32
-
33
-
34
-
35
-
36
-
37
-
38
-
39
-
40
-
41
-
42
-
43
-
44
-
45
-
46
-
47
-
48
-
49
-
50
-
51
-
52
-
53
-
54
-
55
-
56
-
57
-
58
-
59
-
60
-
61
-
62
-
63
-
64
-
65
-
66
-
67
-
68
-
69
-
70
-
71
-
72
-
73
-
74
-
75
-
76
-
77
-
78
-
79
-
80
-
81
-
82
-
83
-
84
-
85
-
86
-
87
 |
 |
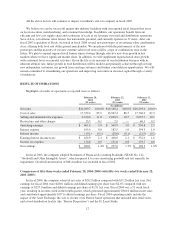
Net Sales
Net sales for fiscal 2004 were $20.2 billion, an increase of 5.5 percent from last year. Retail food sales were
52.2 percent of net sales for fiscal 2004 compared with 51.4 percent last year. Food distribution sales were 47.8
percent of net sales for fiscal 2004 compared with 48.6 percent last year.
Retail food sales for fiscal 2004 increased 7.1 percent compared with last year, primarily reflecting new
store openings, increases in same-store sales and the benefit of the extra week. Same-store retail sales for fiscal
2004 were positive 2.1 percent.
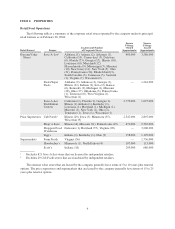
Fiscal 2004 store activity, including licensed units, resulted in 107 new stores opened and 41 stores closed,
including the sale or closure of our Denver based stores, for a total of 1,483 stores at year end. Total square
footage increased approximately 3.8 percent over the prior year.
Food distribution sales for fiscal 2004 increased 3.7 percent compared with last year, primarily reflecting
the impact of new customer affiliations and the benefit of the extra week, which more than offset customer
attrition, and the net revenue loss as a result of the Asset Exchange.
Gross Profit
Gross profit (calculated as net sales less cost of sales), as a percent of net sales, was 14.1 percent for fiscal
2004 compared with 13.5 percent last year. The increase in gross profit, as a percent of net sales, primarily
reflects improved merchandising execution for retail, including the expansion of general merchandise in the
extreme value format, and the growing proportion of our retail food business, which operates at a higher gross
profit margin as a percentage of net sales than does the food distribution business.
Selling and Administrative Expenses
Selling and administrative expenses, as a percentage of net sales, were 11.0 percent for fiscal 2004
compared with 10.5 percent last year. The increase in selling and administrative expenses, as a percent of net
sales, primarily reflects increases in employee benefit and incentive related costs, costs associated with the
Denver Disposition, including related reserves for closed stores, $10.8 million in additional reserves for non-
operating properties and approximately $5 million in net litigation settlements.
Restructure and Other Charges
In fiscal 2004, the company incurred $15.5 million, or 0.1 percent of net sales, in pre-tax restructure and
other charges, consisting of $8.5 million for changes in estimates on exited real estate in certain markets for food
distribution and $7.0 million for increased liabilities associated with employee benefit related costs from
previously exited food distribution facilities.
Operating Earnings
Operating earnings for fiscal 2004 increased 5.5 percent to $601.4 million compared with $569.9 million
last year. Fiscal 2004 operating earnings include $15.5 million in pre-tax restructure and other charges. Fiscal
2003 operating earnings include $2.9 million in pre-tax restructure and other charges. Retail food operating
earnings for fiscal 2004 increased 1.7 percent to $444.0 million, or 4.2 percent of net sales, from last year’s
operating earnings of $436.5 million, or 4.4 percent of net sales. The increase in retail food operating earnings
was primarily due to growth of new stores, improved merchandising execution and the benefit of the extra week
which were substantially offset by increases in employee benefit and incentive related costs, costs associated
with the Denver Disposition, including related reserves for closed stores and the impact of the St. Louis Strike.
Food distribution operating earnings for fiscal 2004 increased 29.6 percent to $222.5 million, or 2.3 percent of
net sales, from last year’s operating earnings of $171.6 million, or 1.8 percent of net sales. The increase in food
distribution operating earnings primarily reflects the increase in sales volume, benefits of efficiency initiatives
implemented during the course of the prior year and the benefit of the extra week.
13