Virgin Media 2007 Annual Report Download - page 96
Download and view the complete annual report
Please find page 96 of the 2007 Virgin Media annual report below. You can navigate through the pages in the report by either clicking on the pages listed below, or by using the keyword search tool below to find specific information within the annual report.-
 1
1 -
2
-
3
-
4
-
5
-
6
-
7
-
8
-
9
-
10
-
11
-
12
-
13
-
14
-
15
-
16
-
17
-
18
-
19
-
20
-
21
-
22
-
23
-
24
-
25
-
26
-
27
-
28
-
29
-
30
-
31
-
32
-
33
-
34
-
35
-
36
-
37
-
38
-
39
-
40
-
41
-
42
-
43
-
44
-
45
-
46
-
47
-
48
-
49
-
50
-
51
-
52
-
53
-
54
-
55
-
56
-
57
-
58
-
59
-
60
-
61
-
62
-
63
-
64
-
65
-
66
-
67
-
68
-
69
-
70
-
71
-
72
-
73
-
74
-
75
-
76
-
77
-
78
-
79
-
80
-
81
-
82
-
83
-
84
-
85
-
 86
86 -
 87
87 -
 88
88 -
 89
89 -
 90
90 -
 91
91 -
 92
92 -
 93
93 -
 94
94 -
 95
95 -
 96
96 -
 97
97 -
 98
98 -
 99
99 -
 100
100 -
 101
101 -
 102
102 -
 103
103 -
 104
104 -
 105
105 -
 106
106 -
107
-
108
-
109
-
110
-
111
-
112
-
113
-
114
-
115
-
116
-
117
-
118
-
119
-
120
-
121
-
122
-
123
-
124
-
125
-
126
-
127
-
128
-
129
-
130
-
131
-
132
-
133
-
134
-
135
-
136
-
137
-
138
-
139
-
140
-
141
-
142
-
143
-
144
-
145
-
146
-
147
-
148
-
149
-
150
-
151
-
152
-
153
-
154
-
155
-
156
-
157
-
158
-
159
-
160
-
161
-
162
-
163
-
164
-
165
-
166
-
167
-
168
-
169
-
170
-
171
-
172
-
173
-
174
-
175
-
176
-
177
-
178
-
179
-
180
-
181
-
182
-
183
-
184
-
185
-
186
-
187
-
188
-
189
-
190
-
191
-
192
-
193
-
194
-
195
-
196
-
197
-
198
-
199
-
200
-
201
-
202
-
203
-
204
-
205
-
206
-
207
-
208
 |
 |
VIRGIN MEDIA INC. AND SUBSIDIARIES
NOTES TO CONSOLIDATED FINANCIAL STATEMENTS (Continued)
2. Significant Accounting Policies (Continued)
earnings and losses of the companies in which we have an investment and such investments are
generally reflected in the consolidated balance sheet at historical cost.
Reclassification
Certain prior year amounts have been reclassified to conform to the current year presentation. The
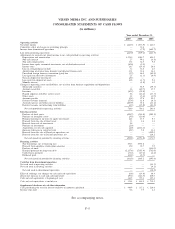
consolidated statements of cash flows include reclassifications of cash flows from operating activities to
provide greater detail on non-cash movements included within this category.
Foreign Currency Translation
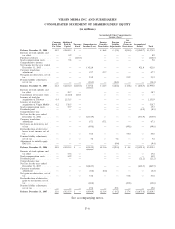
Our functional currency is the pound sterling. Exchange gains and losses on translation of our net
equity investments in subsidiaries having functional currencies other than the pound sterling are
reported as a separate component of accumulated other comprehensive income (loss) in shareholders’
equity. Foreign currency transactions involving amounts denominated in currencies other than the
functional currency are remeasured each period with gains and losses recorded in the statement of
operations.
Cash Equivalents and Restricted Cash
Cash equivalents are short-term highly liquid investments purchased with an original maturity of
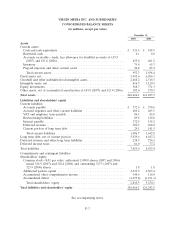
three months or less. We had cash equivalents totaling £218.7 million and £322.1 million as at
December 31, 2007 and 2006, respectively.
Restricted cash balances of £6.1 million and £6.0 million as at December 31, 2007 and 2006,
respectively, represent cash balances collateralized against performance bonds given on our behalf.
Trade Receivables
Our trade receivables are stated at outstanding principal balance, net of allowance for doubtful
accounts. Allowances for doubtful accounts are estimated based on the current aging of trade
receivables, prior collection experience and future expectations of conditions that might impact
recoverability. The allowance for doubtful accounts was £19.5 million at December 31, 2007 and
£51.8 million at December 31, 2006.
Concentrations of Credit Risk
Our financial instruments that are exposed to concentrations of credit risk consist primarily of
trade receivables. Concentrations of credit risk with respect to trade receivables are limited because of
the large number of customers and their dispersion across geographic areas. We perform periodic credit
evaluations of our Business customers’ financial condition and generally do not require collateral. At
December 31, 2007, we did not have significant credit risk concentrations. No single group or customer
represents greater than 10% of total accounts receivable.
Inventory
Inventory consists of consumer goods for re-sale and programming inventory. Consumer goods for
re-sale are valued at the lower of cost or market value using the first-in, first-out, or FIFO method.
Cost represents the invoiced purchase cost of inventory. This valuation requires us to make judgments,
F-10