Virgin Media 2007 Annual Report Download - page 103
Download and view the complete annual report
Please find page 103 of the 2007 Virgin Media annual report below. You can navigate through the pages in the report by either clicking on the pages listed below, or by using the keyword search tool below to find specific information within the annual report.-
 1
1 -
2
-
3
-
4
-
5
-
6
-
7
-
8
-
9
-
10
-
11
-
12
-
13
-
14
-
15
-
16
-
17
-
18
-
19
-
20
-
21
-
22
-
23
-
24
-
25
-
26
-
27
-
28
-
29
-
30
-
31
-
32
-
33
-
34
-
35
-
36
-
37
-
38
-
39
-
40
-
41
-
42
-
43
-
44
-
45
-
46
-
47
-
48
-
49
-
50
-
51
-
52
-
53
-
54
-
55
-
56
-
57
-
58
-
59
-
60
-
61
-
62
-
63
-
64
-
65
-
66
-
67
-
68
-
69
-
70
-
71
-
72
-
73
-
74
-
75
-
76
-
77
-
78
-
79
-
80
-
81
-
82
-
83
-
84
-
85
-
86
-
87
-
88
-
89
-
90
-
91
-
92
-
 93
93 -
 94
94 -
 95
95 -
 96
96 -
 97
97 -
 98
98 -
 99
99 -
 100
100 -
 101
101 -
 102
102 -
 103
103 -
 104
104 -
 105
105 -
 106
106 -
 107
107 -
 108
108 -
 109
109 -
 110
110 -
 111
111 -
 112
112 -
 113
113 -
114
-
115
-
116
-
117
-
118
-
119
-
120
-
121
-
122
-
123
-
124
-
125
-
126
-
127
-
128
-
129
-
130
-
131
-
132
-
133
-
134
-
135
-
136
-
137
-
138
-
139
-
140
-
141
-
142
-
143
-
144
-
145
-
146
-
147
-
148
-
149
-
150
-
151
-
152
-
153
-
154
-
155
-
156
-
157
-
158
-
159
-
160
-
161
-
162
-
163
-
164
-
165
-
166
-
167
-
168
-
169
-
170
-
171
-
172
-
173
-
174
-
175
-
176
-
177
-
178
-
179
-
180
-
181
-
182
-
183
-
184
-
185
-
186
-
187
-
188
-
189
-
190
-
191
-
192
-
193
-
194
-
195
-
196
-
197
-
198
-
199
-
200
-
201
-
202
-
203
-
204
-
205
-
206
-
207
-
208
 |
 |

VIRGIN MEDIA INC. AND SUBSIDIARIES
NOTES TO CONSOLIDATED FINANCIAL STATEMENTS (Continued)
2. Significant Accounting Policies (Continued)
Software Development Costs
We capitalize costs related to computer software developed or obtained for internal use in
accordance with SOP 98-1, Accounting for the Costs of Computer Software Developed or Obtained for
Internal Use. Software obtained for internal use has generally been enterprise-level business and finance
software that we customize to meet our specific operational needs. Costs incurred in the application
development phase are capitalized and amortized over their useful lives, which are generally three to
five years. We have not sold, leased or licensed software developed for internal use to our customers
and we have no intention of doing so in the future.
Income Taxes
We provide for income taxes in accordance with FASB Statement No. 109, Accounting for Income
Taxes. Judgment is required in determining our provision for income taxes, deferred tax assets and
liabilities and the extent to which deferred tax assets can be recognized. We recognize deferred tax
assets only if it is more likely than not that sufficient taxable income will be available in the future
against which the temporary differences and unused tax losses can be utilized. We have considered
future taxable income and tax planning strategies in assessing whether deferred tax assets should be
recognized.
In June 2006, the FASB issued FASB Interpretation No. 48, Accounting for Uncertainty in Income
Taxes—an interpretation of FASB Statement 109, or FIN 48. FIN 48 prescribes a comprehensive model
for recognizing, measuring, presenting and disclosing in the financial statements tax positions taken or
expected to be taken on a tax return, including a decision whether to file or not to file in a particular
jurisdiction. We adopted FIN 48 on January 1, 2007. The adoption did not have a material effect on
our consolidated financial statements.
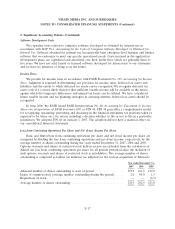
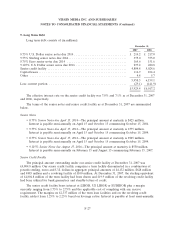
Loss from Continuing Operations Per Share and Net (Loss) Income Per Share
Basic and diluted loss from continuing operations per share and net (loss) income per share are
computed by dividing the loss from continuing operations and net (loss) income, respectively, by the
average number of shares outstanding during the years ended December 31, 2007, 2006 and 2005.
Options, warrants and shares of restricted stock held in escrow are excluded from the calculation of
diluted net loss from continuing operations per share for all periods presented since the inclusion of
such options, warrants and shares of restricted stock is anti-dilutive. The average number of shares
outstanding is computed as follows (in millions) (as adjusted for the reverse acquisition of Telewest):
Year ended December 31,
2007 2006 2005
Adjusted number of shares outstanding at start of period ................. 323.9 212.9 219.0
Issues of common stock (average number outstanding during the period) ..... 2.0 80.0 1.3
Repurchase of stock ............................................ — — (6.5)
Average number of shares outstanding .............................. 325.9 292.9 213.8
F-17