Virgin Media 2007 Annual Report Download - page 192
Download and view the complete annual report
Please find page 192 of the 2007 Virgin Media annual report below. You can navigate through the pages in the report by either clicking on the pages listed below, or by using the keyword search tool below to find specific information within the annual report.-
 1
1 -
2
-
3
-
4
-
5
-
6
-
7
-
8
-
9
-
10
-
11
-
12
-
13
-
14
-
15
-
16
-
17
-
18
-
19
-
20
-
21
-
22
-
23
-
24
-
25
-
26
-
27
-
28
-
29
-
30
-
31
-
32
-
33
-
34
-
35
-
36
-
37
-
38
-
39
-
40
-
41
-
42
-
43
-
44
-
45
-
46
-
47
-
48
-
49
-
50
-
51
-
52
-
53
-
54
-
55
-
56
-
57
-
58
-
59
-
60
-
61
-
62
-
63
-
64
-
65
-
66
-
67
-
68
-
69
-
70
-
71
-
72
-
73
-
74
-
75
-
76
-
77
-
78
-
79
-
80
-
81
-
82
-
83
-
84
-
85
-
86
-
87
-
88
-
89
-
90
-
91
-
92
-
93
-
94
-
95
-
96
-
97
-
98
-
99
-
100
-
101
-
102
-
103
-
104
-
105
-
106
-
107
-
108
-
109
-
110
-
111
-
112
-
113
-
114
-
115
-
116
-
117
-
118
-
119
-
120
-
121
-
122
-
123
-
124
-
125
-
126
-
127
-
128
-
129
-
130
-
131
-
132
-
133
-
134
-
135
-
136
-
137
-
138
-
139
-
140
-
141
-
142
-
143
-
144
-
145
-
146
-
147
-
148
-
149
-
150
-
151
-
152
-
153
-
154
-
155
-
156
-
157
-
158
-
159
-
160
-
161
-
162
-
163
-
164
-
165
-
166
-
167
-
168
-
169
-
170
-
171
-
172
-
173
-
174
-
175
-
176
-
177
-
178
-
179
-
180
-
181
-
 182
182 -
 183
183 -
 184
184 -
 185
185 -
 186
186 -
 187
187 -
 188
188 -
 189
189 -
 190
190 -
 191
191 -
 192
192 -
 193
193 -
 194
194 -
 195
195 -
 196
196 -
 197
197 -
 198
198 -
 199
199 -
 200
200 -
 201
201 -
 202
202 -
203
-
204
-
205
-
206
-
207
-
208
 |
 |

VIRGIN MEDIA INVESTMENT HOLDINGS LIMITED AND SUBSIDIARIES
NOTES TO CONSOLIDATED FINANCIAL STATEMENTS (Continued)
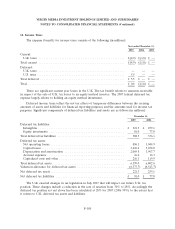
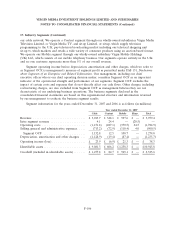
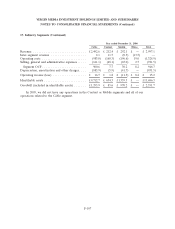
17. Industry Segments (Continued)
our cable network. We operate a Content segment through our wholly-owned subsidiaries Virgin Media
Television Limited, or Virgin Media TV, and sit-up Limited, or sit-up, which supply television
programming to the U.K. pay-television broadcasting market including our televised shopping unit
sit-up tv, which markets and retails a wide variety of consumer products using an auction-based format.
We operate our Mobile segment through our wholly-owned subsidiary Virgin Mobile Holdings
(UK) Ltd., which consists of our mobile telephony business. Our segments operate entirely in the U.K.
and no one customer represents more than 5% of our overall revenue.
Segment operating income before depreciation, amortization and other charges, which we refer to
as Segment OCF, is management’s measure of segment profit as permitted under FAS 131, Disclosures
about Segments of an Enterprise and Related Information. Our management, including our chief
executive officer who is our chief operating decision maker, considers Segment OCF as an important
indicator of the operational strength and performance of our segments. Segment OCF excludes the
impact of certain costs and expenses that do not directly affect our cash flows. Other charges, including
restructuring charges, are also excluded from Segment OCF as management believes they are not
characteristic of our underlying business operations. The business segments disclosed in the
consolidated financial statements are based on this organizational structure and information reviewed
by our management to evaluate the business segment results.
Segment information for the years ended December 31, 2007 and 2006 is as follows (in millions):
Year ended December 31, 2007
Cable Content Mobile Elims. Total
Revenue .............................. £ 3,013.7 £ 348.1 £ 597.6 £ — £ 3,959.4
Inter segment revenue .................... 4.1 24.4 — (28.5) —
Operating costs ......................... (1,151.8) (287.1) (370.5) 24.5 (1,784.9)
Selling, general and administrative expenses ..... (713.2) (72.9) (118.4) 4.0 (900.5)
Segment OCF ........................ 1,152.8 12.5 108.7 — 1,274.0
Depreciation, amortization and other charges . . . (1,128.9) (19.4) (87.4) — (1,235.7)
Operating income (loss) ................... £ 23.9 £ (6.9) £ 21.3 £ — £ 38.3
Identifiable assets ........................ £ 9,081.3 £ 606.2 £ 1,258.3 £ — £ 10,945.8
Goodwill (included in identifiable assets) ....... £ 1,277.8 £ 82.7 £ 965.1 £ — £ 2,325.6
F-106