Virgin Media 2007 Annual Report Download - page 148
Download and view the complete annual report
Please find page 148 of the 2007 Virgin Media annual report below. You can navigate through the pages in the report by either clicking on the pages listed below, or by using the keyword search tool below to find specific information within the annual report.-
 1
1 -
2
-
3
-
4
-
5
-
6
-
7
-
8
-
9
-
10
-
11
-
12
-
13
-
14
-
15
-
16
-
17
-
18
-
19
-
20
-
21
-
22
-
23
-
24
-
25
-
26
-
27
-
28
-
29
-
30
-
31
-
32
-
33
-
34
-
35
-
36
-
37
-
38
-
39
-
40
-
41
-
42
-
43
-
44
-
45
-
46
-
47
-
48
-
49
-
50
-
51
-
52
-
53
-
54
-
55
-
56
-
57
-
58
-
59
-
60
-
61
-
62
-
63
-
64
-
65
-
66
-
67
-
68
-
69
-
70
-
71
-
72
-
73
-
74
-
75
-
76
-
77
-
78
-
79
-
80
-
81
-
82
-
83
-
84
-
85
-
86
-
87
-
88
-
89
-
90
-
91
-
92
-
93
-
94
-
95
-
96
-
97
-
98
-
99
-
100
-
101
-
102
-
103
-
104
-
105
-
106
-
107
-
108
-
109
-
110
-
111
-
112
-
113
-
114
-
115
-
116
-
117
-
118
-
119
-
120
-
121
-
122
-
123
-
124
-
125
-
126
-
127
-
128
-
129
-
130
-
131
-
132
-
133
-
134
-
135
-
136
-
137
-
 138
138 -
 139
139 -
 140
140 -
 141
141 -
 142
142 -
 143
143 -
 144
144 -
 145
145 -
 146
146 -
 147
147 -
 148
148 -
 149
149 -
 150
150 -
 151
151 -
 152
152 -
 153
153 -
 154
154 -
 155
155 -
 156
156 -
 157
157 -
 158
158 -
159
-
160
-
161
-
162
-
163
-
164
-
165
-
166
-
167
-
168
-
169
-
170
-
171
-
172
-
173
-
174
-
175
-
176
-
177
-
178
-
179
-
180
-
181
-
182
-
183
-
184
-
185
-
186
-
187
-
188
-
189
-
190
-
191
-
192
-
193
-
194
-
195
-
196
-
197
-
198
-
199
-
200
-
201
-
202
-
203
-
204
-
205
-
206
-
207
-
208
 |
 |

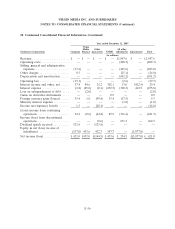
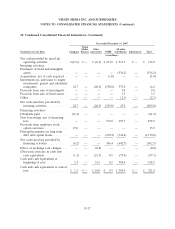
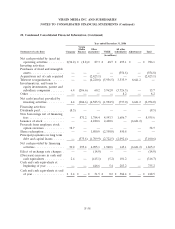
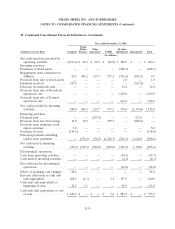
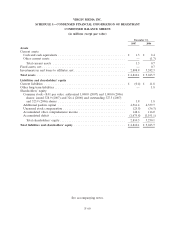
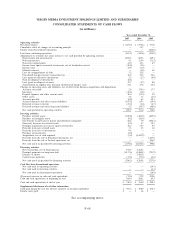
VIRGIN MEDIA INC.
CONDENSED FINANCIAL INFORMATION OF REGISTRANT
STATEMENT OF CASH FLOWS
(in millions)
Year ended December 31,
2007 2006 2005
Net cash used in operating activities ............................. £(17.6) £(34.2) £(161.0)
Investing activities
Dividend received ......................................... — — 523.8
Investments in and loans to affiliates ........................... 22.7 6.4 56.2
Net cash provided by investing activities ....................... 22.7 6.4 580.0
Financing activities
Proceeds from new borrowings ................................ — — 10.0
Proceeds from employee stock option exercises .................... 15.0 38.7 5.0
Purchase of stock ......................................... — — (114.0)
Dividends paid ........................................... (21.2) (8.5) —
Net cash (used in) provided by financing activities ................ (6.2) 30.2 (99.0)
Effect of exchange rate changes on cash and cash equivalents ........... — — 88.4
(Decrease) increase in cash and cash equivalents .................... (1.1) 2.4 408.4
Cash and cash equivalents at beginning of year ...................... 2.4 — 38.2
Cash and cash equivalents at end of year .......................... £ 1.3 £ 2.4 £446.6
Supplemental disclosure of cash flow information
Cash paid for interest ........................................ £ — £ — £ —
Income taxes paid ........................................... — 3.1 2.2
See accompanying notes.
F-62