Virgin Media 2007 Annual Report Download - page 45
Download and view the complete annual report
Please find page 45 of the 2007 Virgin Media annual report below. You can navigate through the pages in the report by either clicking on the pages listed below, or by using the keyword search tool below to find specific information within the annual report.-
 1
1 -
2
-
3
-
4
-
5
-
6
-
7
-
8
-
9
-
10
-
11
-
12
-
13
-
14
-
15
-
16
-
17
-
18
-
19
-
20
-
21
-
22
-
23
-
24
-
25
-
26
-
27
-
28
-
29
-
30
-
31
-
32
-
33
-
34
-
 35
35 -
 36
36 -
 37
37 -
 38
38 -
 39
39 -
 40
40 -
 41
41 -
 42
42 -
 43
43 -
 44
44 -
 45
45 -
 46
46 -
 47
47 -
 48
48 -
 49
49 -
 50
50 -
 51
51 -
 52
52 -
 53
53 -
 54
54 -
 55
55 -
56
-
57
-
58
-
59
-
60
-
61
-
62
-
63
-
64
-
65
-
66
-
67
-
68
-
69
-
70
-
71
-
72
-
73
-
74
-
75
-
76
-
77
-
78
-
79
-
80
-
81
-
82
-
83
-
84
-
85
-
86
-
87
-
88
-
89
-
90
-
91
-
92
-
93
-
94
-
95
-
96
-
97
-
98
-
99
-
100
-
101
-
102
-
103
-
104
-
105
-
106
-
107
-
108
-
109
-
110
-
111
-
112
-
113
-
114
-
115
-
116
-
117
-
118
-
119
-
120
-
121
-
122
-
123
-
124
-
125
-
126
-
127
-
128
-
129
-
130
-
131
-
132
-
133
-
134
-
135
-
136
-
137
-
138
-
139
-
140
-
141
-
142
-
143
-
144
-
145
-
146
-
147
-
148
-
149
-
150
-
151
-
152
-
153
-
154
-
155
-
156
-
157
-
158
-
159
-
160
-
161
-
162
-
163
-
164
-
165
-
166
-
167
-
168
-
169
-
170
-
171
-
172
-
173
-
174
-
175
-
176
-
177
-
178
-
179
-
180
-
181
-
182
-
183
-
184
-
185
-
186
-
187
-
188
-
189
-
190
-
191
-
192
-
193
-
194
-
195
-
196
-
197
-
198
-
199
-
200
-
201
-
202
-
203
-
204
-
205
-
206
-
207
-
208
 |
 |
22FEB200819420214
Future payments of regular quarterly dividends by us are at the discretion of the board of directors
and will be subject to our future needs and uses of cash, which could include investments in operations,
the repayment of debt, and share repurchase programs. In addition, the terms of our and our
subsidiaries’ existing and future indebtedness and the laws of jurisdictions under which those
subsidiaries are organized limit the payment of dividends, loan repayments and other distributions to us
under many circumstances.
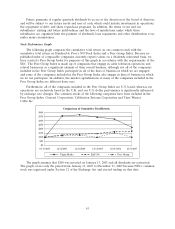
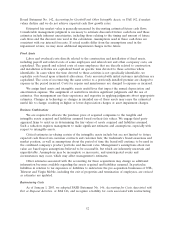
Stock Performance Graph
The following graph compares the cumulative total return on our common stock with the
cumulative total return on Standard & Poor’s 500 Stock Index and a Peer Group Index. Because no
published index of comparable companies currently reports values on a dividends reinvested basis, we
have created a Peer Group Index for purposes of this graph in accordance with the requirements of the
SEC. The Peer Group Index is made up of companies that engage in cable television operations and
related businesses as a significant element of their overall business, although not all of the companies
included in the Peer Group Index participate in all of the lines of business in which we are engaged
and some of the companies included in the Peer Group Index also engage in lines of business in which
we do not participate. In addition, the market capitalizations of many of the companies included in the
Peer Group Index are different from ours.
Furthermore, all of the companies included in the Peer Group Index are U.S. based, whereas our
operations are exclusively based in the U.K. and our U.S. dollar performance is significantly influenced
by exchange rate changes. The common stocks of the following companies have been included in the
Peer Group Index: Comcast Corporation, Cablevision Systems Corporation and Time Warner
Cable Inc.
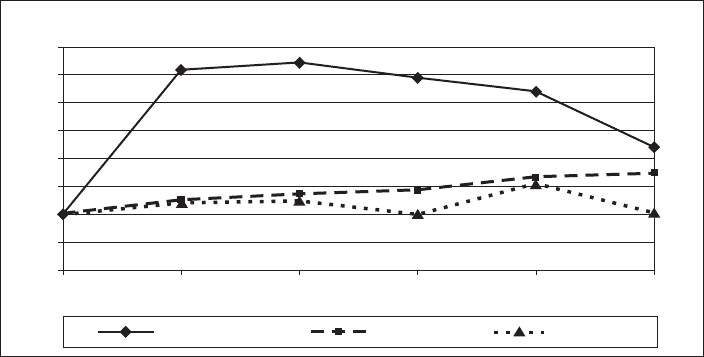
Comparison of Cumulative Total Return
$0
$50
$100
$150
$200
$250
$300
$350
$400
01/13/2003 12/31/2007
Virgin Media S&P 500 Peer Group
12/31/2003 12/31/200612/31/200512/31/2004
The graph assumes that $100 was invested on January 13, 2003 and all dividends are reinvested.
The graph covers only the period from January 13, 2003 to December 31, 2007 because NTL’s common
stock was registered under Section 12 of the Exchange Act and started trading on that date.
43