Virgin Media 2007 Annual Report Download - page 60
Download and view the complete annual report
Please find page 60 of the 2007 Virgin Media annual report below. You can navigate through the pages in the report by either clicking on the pages listed below, or by using the keyword search tool below to find specific information within the annual report.-
 1
1 -
2
-
3
-
4
-
5
-
6
-
7
-
8
-
9
-
10
-
11
-
12
-
13
-
14
-
15
-
16
-
17
-
18
-
19
-
20
-
21
-
22
-
23
-
24
-
25
-
26
-
27
-
28
-
29
-
30
-
31
-
32
-
33
-
34
-
35
-
36
-
37
-
38
-
39
-
40
-
41
-
42
-
43
-
44
-
45
-
46
-
47
-
48
-
49
-
 50
50 -
 51
51 -
 52
52 -
 53
53 -
 54
54 -
 55
55 -
 56
56 -
 57
57 -
 58
58 -
 59
59 -
 60
60 -
 61
61 -
 62
62 -
 63
63 -
 64
64 -
 65
65 -
 66
66 -
 67
67 -
 68
68 -
 69
69 -
 70
70 -
71
-
72
-
73
-
74
-
75
-
76
-
77
-
78
-
79
-
80
-
81
-
82
-
83
-
84
-
85
-
86
-
87
-
88
-
89
-
90
-
91
-
92
-
93
-
94
-
95
-
96
-
97
-
98
-
99
-
100
-
101
-
102
-
103
-
104
-
105
-
106
-
107
-
108
-
109
-
110
-
111
-
112
-
113
-
114
-
115
-
116
-
117
-
118
-
119
-
120
-
121
-
122
-
123
-
124
-
125
-
126
-
127
-
128
-
129
-
130
-
131
-
132
-
133
-
134
-
135
-
136
-
137
-
138
-
139
-
140
-
141
-
142
-
143
-
144
-
145
-
146
-
147
-
148
-
149
-
150
-
151
-
152
-
153
-
154
-
155
-
156
-
157
-
158
-
159
-
160
-
161
-
162
-
163
-
164
-
165
-
166
-
167
-
168
-
169
-
170
-
171
-
172
-
173
-
174
-
175
-
176
-
177
-
178
-
179
-
180
-
181
-
182
-
183
-
184
-
185
-
186
-
187
-
188
-
189
-
190
-
191
-
192
-
193
-
194
-
195
-
196
-
197
-
198
-
199
-
200
-
201
-
202
-
203
-
204
-
205
-
206
-
207
-
208
 |
 |

Content and sit-up segments into the combined company’s Content segment. The pro forma data has
been calculated on a basis consistent with the pro forma financial information filed with the Securities
and Exchange Commission under our Form 8-K/A on May 10, 2006. We believe that a pro forma
comparison of these segments is more relevant than a historic comparison as: (a) in respect of our
Cable segment, the size of the acquired legacy Telewest cable business would obscure any meaningful
discussion of changes in our Cable segment if viewed on a historical basis; and (b) we did not have a
Content segment prior to March 3, 2006. Comparative pro forma results of our Mobile segment have
not been presented.
The reportable segments disclosed in this annual report are based on our management
organizational structure as of December 31, 2007. Future changes to this organizational structure may
result in changes to the reportable segments disclosed.
Segment operating income before depreciation, amortization and other charges, which we refer to
as Segment OCF, is management’s measure of segment profit as permitted under FAS 131, Disclosures
about Segments of an Enterprise and Related Information. Our management, including our chief
executive officer who is our chief operating decision maker, considers Segment OCF as an important
indicator of the operational strength and performance of our segments. Segment OCF excludes the
impact of costs and expenses that do not directly affect our cash flows. Other charges, including
restructuring charges, are also excluded from Segment OCF as management believes they are not
characteristic of our underlying business operations.
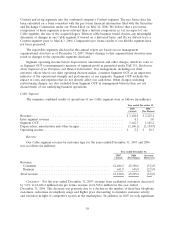
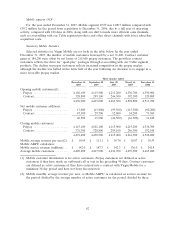
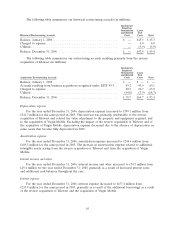
Cable Segment
The summary combined results of operations of our Cable segment were as follows (in millions):
Year ended December 31,
2007 2006
(Actual) (Pro Forma)
Revenue .................................................... £3,128.0 £ 3,225.4
Inter segment revenue .......................................... 4.1 3.0
Segment OCF ................................................ 1,162.3 1,145.2
Depreciation, amortization and other charges ......................... (1,160.1) (1,134.9)
Operating income ............................................. £ 2.2 £ 10.3
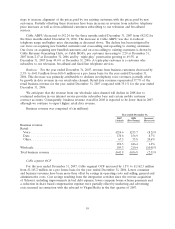
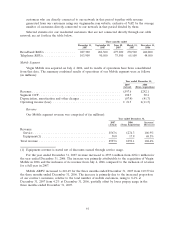
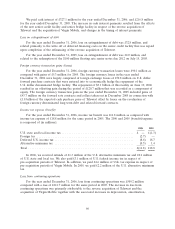
Revenue
Our Cable segment revenue by customer type for the years ended December 31, 2007 and 2006
was as follows (in millions):
Year ended December 31,
2007 2006 Increase/
(Actual) (Pro Forma) (Decrease)
Revenue:
Consumer ......................................... £2,486.2 £2,568.6 (3.2)%
Business ........................................... 641.8 656.8 (2.3)%
Total revenue ......................................... £3,128.0 £3,225.4 (3.0)%
Consumer: For the year ended December 31, 2007, revenue from residential customers decreased
by 3.2% to £2,486.2 million from pro forma revenue of £2,568.6 million for the year ended
December 31, 2006. This decrease was primarily due to a decline in the number of fixed line telephone
customers, reductions in telephony usage and higher price discounting to stimulate customer activity
and retention in light of competitive factors in the marketplace. In addition, in 2007 we took significant
58