Virgin Media 2007 Annual Report Download - page 47
Download and view the complete annual report
Please find page 47 of the 2007 Virgin Media annual report below. You can navigate through the pages in the report by either clicking on the pages listed below, or by using the keyword search tool below to find specific information within the annual report.-
 1
1 -
2
-
3
-
4
-
5
-
6
-
7
-
8
-
9
-
10
-
11
-
12
-
13
-
14
-
15
-
16
-
17
-
18
-
19
-
20
-
21
-
22
-
23
-
24
-
25
-
26
-
27
-
28
-
29
-
30
-
31
-
32
-
33
-
34
-
35
-
36
-
 37
37 -
 38
38 -
 39
39 -
 40
40 -
 41
41 -
 42
42 -
 43
43 -
 44
44 -
 45
45 -
 46
46 -
 47
47 -
 48
48 -
 49
49 -
 50
50 -
 51
51 -
 52
52 -
 53
53 -
 54
54 -
 55
55 -
 56
56 -
 57
57 -
58
-
59
-
60
-
61
-
62
-
63
-
64
-
65
-
66
-
67
-
68
-
69
-
70
-
71
-
72
-
73
-
74
-
75
-
76
-
77
-
78
-
79
-
80
-
81
-
82
-
83
-
84
-
85
-
86
-
87
-
88
-
89
-
90
-
91
-
92
-
93
-
94
-
95
-
96
-
97
-
98
-
99
-
100
-
101
-
102
-
103
-
104
-
105
-
106
-
107
-
108
-
109
-
110
-
111
-
112
-
113
-
114
-
115
-
116
-
117
-
118
-
119
-
120
-
121
-
122
-
123
-
124
-
125
-
126
-
127
-
128
-
129
-
130
-
131
-
132
-
133
-
134
-
135
-
136
-
137
-
138
-
139
-
140
-
141
-
142
-
143
-
144
-
145
-
146
-
147
-
148
-
149
-
150
-
151
-
152
-
153
-
154
-
155
-
156
-
157
-
158
-
159
-
160
-
161
-
162
-
163
-
164
-
165
-
166
-
167
-
168
-
169
-
170
-
171
-
172
-
173
-
174
-
175
-
176
-
177
-
178
-
179
-
180
-
181
-
182
-
183
-
184
-
185
-
186
-
187
-
188
-
189
-
190
-
191
-
192
-
193
-
194
-
195
-
196
-
197
-
198
-
199
-
200
-
201
-
202
-
203
-
204
-
205
-
206
-
207
-
208
 |
 |

statements included in this annual report for the period through March 3, 2006 are those of NTL,
which is now known as Virgin Media Holdings Inc., and for the period since March 3, 2006, these
financial statements reflect the reverse acquisition of Telewest. See note 1 to the consolidated financial
statements of Virgin Media Inc.
On May 9, 2005, we sold our operations in the Republic of Ireland. The results of operations of
the Ireland operations have been removed from our results of continuing operations for all periods
presented.
Following the disposal of our operations in the Republic of Ireland, all of our revenue from
continuing operations and substantially all of our assets are denominated in U.K. pounds sterling.
Consequently, we now report our results in pounds sterling. Financial information for all periods
presented has been restated accordingly.
We entered into an agreement for the sale of our Broadcast operations on December 1, 2004 and
closed the sale on January 31, 2005. As of December 31, 2004, we accounted for the Broadcast
operations as a discontinued operation. Therefore, the results of operations of the Broadcast operations
have been removed from our results of continuing operations for all periods presented.
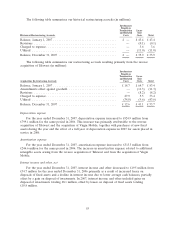
We adopted fresh-start reporting upon our emergence from Chapter 11 reorganization in
accordance with SOP 90-7, Financial Reporting By Entity in reorganization under the Bankruptcy Code, or
SOP 90-7. For financial reporting purposes, the effects of the completion of the plan of reorganization
as well as adjustments for fresh-start reporting were recorded as of January 1, 2003. Pursuant to fresh-
start reporting, a new entity was deemed to have been created for financial reporting purposes. The
carrying values of our assets were adjusted to their reorganization values, which were equivalent to
their estimated fair values at January 1, 2003. The carrying values of our liabilities were adjusted to
their present values at January 1, 2003. As a result, on January 1, 2003, we recognized £3,655.8 million
for both operating income and income from continuing operations.
Year ended December 31,
2007 2006 2005 2004 2003
(in millions, except per share data)
Statement of Operations Data:
Revenue .............................. £4,073.7 £3,602.2 £1,947.6 £2,000.3 £1,887.4
Operating income (loss) ................... 16.6 9.8 (19.7) (52.5) (194.4)
Loss from continuing operations ............. (463.5) (509.2) (241.7) (509.4) (606.7)
Basic and diluted loss from continuing operations
per share ............................ £ (1.42) £ (1.74) £ (1.13) £ (2.34) £ (3.84)
Average number of shares outstanding ......... 325.9 292.9 213.8 218.0 158.0
As of December 31,
2007 2006 2005 2004 2003
(in millions, except per share data)
Balance Sheet Data:
Cash, cash equivalents and marketable
securities ........................... £ 321.4 £ 418.5 £ 832.1 £ 136.8 £ 446.1
Working capital ........................ (453.4) (604.4) 529.9 (286.8) (48.1)
Fixed assets .......................... 5,655.6 6,026.3 3,294.9 3,531.6 3,857.2
Total assets ........................... 10,466.1 11,243.5 4,988.5 5,493.3 6,262.1
Long term debt ........................ 5,958.5 6,159.1 2,280.0 3,013.5 3,211.9
Shareholders’ equity .................... 2,810.5 3,230.1 1,955.0 1,574.5 2,068.6
Dividends declared per common share
(in U.S. dollars) ...................... $ 0.13 $ 0.05 — — —
45