Virgin Media 2007 Annual Report Download - page 70
Download and view the complete annual report
Please find page 70 of the 2007 Virgin Media annual report below. You can navigate through the pages in the report by either clicking on the pages listed below, or by using the keyword search tool below to find specific information within the annual report.-
 1
1 -
2
-
3
-
4
-
5
-
6
-
7
-
8
-
9
-
10
-
11
-
12
-
13
-
14
-
15
-
16
-
17
-
18
-
19
-
20
-
21
-
22
-
23
-
24
-
25
-
26
-
27
-
28
-
29
-
30
-
31
-
32
-
33
-
34
-
35
-
36
-
37
-
38
-
39
-
40
-
41
-
42
-
43
-
44
-
45
-
46
-
47
-
48
-
49
-
50
-
51
-
52
-
53
-
54
-
55
-
56
-
57
-
58
-
59
-
 60
60 -
 61
61 -
 62
62 -
 63
63 -
 64
64 -
 65
65 -
 66
66 -
 67
67 -
 68
68 -
 69
69 -
 70
70 -
 71
71 -
 72
72 -
 73
73 -
 74
74 -
 75
75 -
 76
76 -
 77
77 -
 78
78 -
 79
79 -
 80
80 -
81
-
82
-
83
-
84
-
85
-
86
-
87
-
88
-
89
-
90
-
91
-
92
-
93
-
94
-
95
-
96
-
97
-
98
-
99
-
100
-
101
-
102
-
103
-
104
-
105
-
106
-
107
-
108
-
109
-
110
-
111
-
112
-
113
-
114
-
115
-
116
-
117
-
118
-
119
-
120
-
121
-
122
-
123
-
124
-
125
-
126
-
127
-
128
-
129
-
130
-
131
-
132
-
133
-
134
-
135
-
136
-
137
-
138
-
139
-
140
-
141
-
142
-
143
-
144
-
145
-
146
-
147
-
148
-
149
-
150
-
151
-
152
-
153
-
154
-
155
-
156
-
157
-
158
-
159
-
160
-
161
-
162
-
163
-
164
-
165
-
166
-
167
-
168
-
169
-
170
-
171
-
172
-
173
-
174
-
175
-
176
-
177
-
178
-
179
-
180
-
181
-
182
-
183
-
184
-
185
-
186
-
187
-
188
-
189
-
190
-
191
-
192
-
193
-
194
-
195
-
196
-
197
-
198
-
199
-
200
-
201
-
202
-
203
-
204
-
205
-
206
-
207
-
208
 |
 |

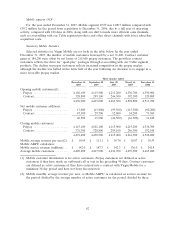
about Segments of an Enterprise and Related Information. Our management, including our chief
executive officer who is our chief operating decision maker, considers Segment OCF as an important
indicator of the operational strength and performance of our segments. Segment OCF excludes the
impact of costs and expenses that do not directly affect our cash flows. Other charges, including
restructuring charges, are also excluded from Segment OCF as management believes they are not
characteristic of our underlying business operations.
Cable Segment
The summary pro forma combined results of operations of our Cable segment were as follows
(in millions):
Year ended December 31,
2006 2005
Revenue ..................................................... £3,225.4 £ 3,205.2
Inter segment revenue ........................................... 3.0 2.6
Segment OCF ................................................. 1,145.2 1,191.7
Depreciation, amortization and other charges .......................... (1,134.9) (1,139.6)
Operating income .............................................. £ 10.3 £ 52.1
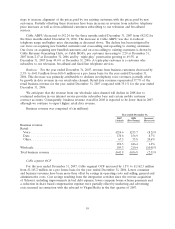
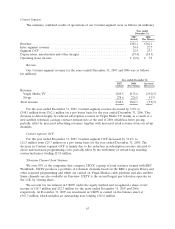
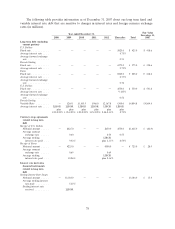
Revenue
Our pro forma Cable segment revenue by customer type for the years ended December 31, 2006
and 2005 was as follows (in millions):
Year ended December 31,
Increase/
2006 2005 (Decrease)
Revenue:
Consumer ........................................... £2,568.6 £2,527.4 1.6%
Business ............................................ 656.8 677.8 (3.1)%
Total revenue .......................................... £3,225.4 £3,205.2 0.6%
Consumer: For the year ended December 31, 2006, pro forma revenue from residential customers
increased by 1.6% to £2,568.6 million from £2,527.4 million for the year ended December 31, 2005.
This increase was driven largely by growth in the number of broadband internet subscribers together
with television and telephony price rises partially offset by lower telephony usage. Cable ARPU
increased steadily through the year, reflecting our drive to encourage triple-play bundling and a focus
on better quality customers. Our focus on acquiring new bundled customers and on cross-selling to
existing customers resulted in Cable RGUs per customer increasing from 2.06 on a pro forma basis at
December 31, 2005 to 2.17 at December 31, 2006 and by triple-play penetration growing from 32.4%
on a pro forma basis at December 31, 2005 to 40.6% at December 31, 2006.
Business: For the year ended December 31, 2006, pro forma revenue from business customers
decreased by 3.1% to £656.8 million from £677.8 million for the year ended December 31, 2005. This
decrease was attributable to declines in telephony voice revenue and lower wholesale and other
revenues, partially offset by greater data installation and rental revenue.
Cable segment OCF
For the year ended December 31, 2006, pro forma Cable segment OCF decreased by 3.9% to
£1,145.2 million from £1,191.7 million for the year ended December 31, 2005. The decrease in OCF
68