Virgin Media 2007 Annual Report Download - page 90
Download and view the complete annual report
Please find page 90 of the 2007 Virgin Media annual report below. You can navigate through the pages in the report by either clicking on the pages listed below, or by using the keyword search tool below to find specific information within the annual report.-
 1
1 -
2
-
3
-
4
-
5
-
6
-
7
-
8
-
9
-
10
-
11
-
12
-
13
-
14
-
15
-
16
-
17
-
18
-
19
-
20
-
21
-
22
-
23
-
24
-
25
-
26
-
27
-
28
-
29
-
30
-
31
-
32
-
33
-
34
-
35
-
36
-
37
-
38
-
39
-
40
-
41
-
42
-
43
-
44
-
45
-
46
-
47
-
48
-
49
-
50
-
51
-
52
-
53
-
54
-
55
-
56
-
57
-
58
-
59
-
60
-
61
-
62
-
63
-
64
-
65
-
66
-
67
-
68
-
69
-
70
-
71
-
72
-
73
-
74
-
75
-
76
-
77
-
78
-
79
-
 80
80 -
 81
81 -
 82
82 -
 83
83 -
 84
84 -
 85
85 -
 86
86 -
 87
87 -
 88
88 -
 89
89 -
 90
90 -
 91
91 -
 92
92 -
 93
93 -
 94
94 -
 95
95 -
 96
96 -
 97
97 -
 98
98 -
 99
99 -
 100
100 -
101
-
102
-
103
-
104
-
105
-
106
-
107
-
108
-
109
-
110
-
111
-
112
-
113
-
114
-
115
-
116
-
117
-
118
-
119
-
120
-
121
-
122
-
123
-
124
-
125
-
126
-
127
-
128
-
129
-
130
-
131
-
132
-
133
-
134
-
135
-
136
-
137
-
138
-
139
-
140
-
141
-
142
-
143
-
144
-
145
-
146
-
147
-
148
-
149
-
150
-
151
-
152
-
153
-
154
-
155
-
156
-
157
-
158
-
159
-
160
-
161
-
162
-
163
-
164
-
165
-
166
-
167
-
168
-
169
-
170
-
171
-
172
-
173
-
174
-
175
-
176
-
177
-
178
-
179
-
180
-
181
-
182
-
183
-
184
-
185
-
186
-
187
-
188
-
189
-
190
-
191
-
192
-
193
-
194
-
195
-
196
-
197
-
198
-
199
-
200
-
201
-
202
-
203
-
204
-
205
-
206
-
207
-
208
 |
 |

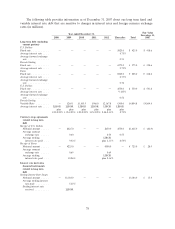
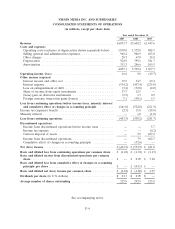
VIRGIN MEDIA INC. AND SUBSIDIARIES
CONSOLIDATED STATEMENTS OF OPERATIONS
(in millions, except per share data)
Year ended December 31,
2007 2006 2005
Revenue .............................................. £4,073.7 £3,602.2 £1,947.6
Costs and expenses
Operating costs (exclusive of depreciation shown separately below) . . 1,830.0 1,572.8 808.3
Selling, general and administrative expenses ................... 960.2 906.9 483.0
Other charges ........................................ 28.7 67.0 24.8
Depreciation ......................................... 924.9 799.1 541.7
Amortization ......................................... 313.3 246.6 109.5
4,057.1 3,592.4 1,967.3
Operating income (loss) ................................... 16.6 9.8 (19.7)
Other income (expense)
Interest income and other, net ............................ 19.5 34.7 29.4
Interest expense ....................................... (514.2) (457.4) (235.8)
Loss on extinguishment of debt ............................ (3.2) (32.8) (2.0)
Share of income from equity investments ..................... 17.7 12.5 —
(Loss) gain on derivative instruments ........................ (2.5) 1.3 0.9
Foreign currency transaction gains (losses) .................... 5.1 (90.1) 5.3
Loss from continuing operations before income taxes, minority interest
and cumulative effect of changes in accounting principle ......... (461.0) (522.0) (221.9)
Income tax (expense) benefit ............................... (2.5) 11.8 (18.8)
Minority interest ........................................ — 1.0 (1.0)
Loss from continuing operations ............................ (463.5) (509.2) (241.7)
Discontinued operations
Income from discontinued operations before income taxes ........ — — 5.7
Income tax expense .................................... — — (0.2)
Gain on disposal of assets ................................ — 7.9 657.2
Income from discontinued operations ....................... — 7.9 662.7
Cumulative effect of changes in accounting principle ............ — (32.6) —
Net (loss) income ....................................... £(463.5) £ (533.9) £ 421.0
Basic and diluted loss from continuing operations per common share . £ (1.42) £ (1.74) £ (1.13)
Basic and diluted income from discontinued operations per common
share ............................................... £ — £ 0.03 £ 3.10
Basic and diluted loss from cumulative effect of changes in accounting
principle per share ..................................... £ — £ (0.11) £ —
Basic and diluted net (loss) income per common share ............ £ (1.42) £ (1.82) £ 1.97
Dividends per share (in U.S. dollars) ......................... $ 0.13 $ 0.05 $ —
Average number of shares outstanding ........................ 325.9 292.9 213.8
See accompanying notes.
F-4