US Airways 2004 Annual Report Download - page 79
Download and view the complete annual report
Please find page 79 of the 2004 US Airways annual report below. You can navigate through the pages in the report by either clicking on the pages listed below, or by using the keyword search tool below to find specific information within the annual report.-
 1
1 -
2
-
3
-
4
-
5
-
6
-
7
-
8
-
9
-
10
-
11
-
12
-
13
-
14
-
15
-
16
-
17
-
18
-
19
-
20
-
21
-
22
-
23
-
24
-
25
-
26
-
27
-
28
-
29
-
30
-
31
-
32
-
33
-
34
-
35
-
36
-
37
-
38
-
39
-
40
-
41
-
42
-
43
-
44
-
45
-
46
-
47
-
48
-
49
-
50
-
51
-
52
-
53
-
54
-
55
-
56
-
57
-
58
-
59
-
60
-
61
-
62
-
63
-
64
-
65
-
66
-
67
-
68
-
 69
69 -
 70
70 -
 71
71 -
 72
72 -
 73
73 -
 74
74 -
 75
75 -
 76
76 -
 77
77 -
 78
78 -
 79
79 -
 80
80 -
 81
81 -
 82
82 -
 83
83 -
 84
84 -
 85
85 -
 86
86 -
 87
87 -
 88
88 -
 89
89 -
90
-
91
-
92
-
93
-
94
-
95
-
96
-
97
-
98
-
99
-
100
-
101
-
102
-
103
-
104
-
105
-
106
-
107
-
108
-
109
-
110
-
111
-
112
-
113
-
114
-
115
-
116
-
117
-
118
-
119
-
120
-
121
-
122
-
123
-
124
-
125
-
126
-
127
-
128
-
129
-
130
-
131
-
132
-
133
-
134
-
135
-
136
-
137
-
138
-
139
-
140
-
141
-
142
-
143
-
144
-
145
-
146
-
147
-
148
-
149
-
150
-
151
-
152
-
153
-
154
-
155
-
156
-
157
-
158
-
159
-
160
-
161
-
162
-
163
-
164
-
165
-
166
-
167
-
168
-
169
-
170
-
171
-
172
-
173
-
174
-
175
-
176
-
177
-
178
-
179
-
180
-
181
-
182
-
183
-
184
-
185
-
186
-
187
-
188
-
189
-
190
-
191
-
192
-
193
-
194
-
195
-
196
-
197
-
198
-
199
-
200
-
201
-
202
-
203
-
204
-
205
-
206
-
207
-
208
-
209
-
210
-
211
-
212
-
213
-
214
-
215
-
216
-
217
-
218
-
219
-
220
-
221
-
222
-
223
-
224
-
225
-
226
-
227
-
228
-
229
-
230
-
231
-
232
-
233
-
234
-
235
-
236
-
237
-
238
-
239
-
240
-
241
-
242
-
243
-
244
-
245
-
246
-
247
-
248
-
249
-
250
-
251
-
252
-
253
-
254
-
255
-
256
-
257
-
258
-
259
-
260
-
261
-
262
-
263
-
264
-
265
-
266
-
267
-
268
-
269
-
270
-
271
-
272
-
273
-
274
-
275
-
276
-
277
-
278
-
279
-
280
-
281
-
282
-
283
-
284
-
285
-
286
-
287
-
288
-
289
-
290
-
291
-
292
-
293
-
294
-
295
-
296
-
297
-
298
-
299
-
300
-
301
-
302
-
303
-
304
-
305
-
306
-
307
-
308
-
309
-
310
-
311
-
312
-
313
-
314
-
315
-
316
-
317
-
318
-
319
-
320
-
321
-
322
-
323
-
324
-
325
-
326
-
327
-
328
-
329
-
330
-
331
-
332
-
333
-
334
-
335
-
336
-
337
-
338
-
339
-
340
-
341
-
342
-
343
-
344
-
345
-
346
 |
 |

Table of Contents
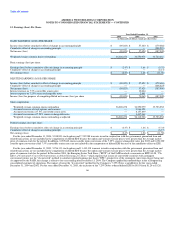
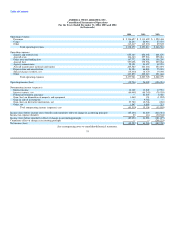
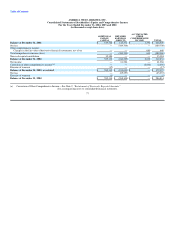
AMERICA WEST AIRLINES, INC.
Consolidated Statements of Cash Flows
For the Years Ended December 31, 2004, 2003 and 2002
(in thousands)
2004 2003 2002
Cash flows from operating activities:
Net income (loss) $ (85,257) $ 61,286 $ (389,700)
Adjustments to reconcile net income (loss) to net cash provided by (used in) operating activities:
Cumulative effect of change in accounting principle — — 208,223
Depreciation and amortization 54,354 66,865 75,894
Amortization of capitalized maintenance 85,590 105,076 111,576
Amortization of deferred credits (8,208) (10,970) (10,077)
Amortization of deferred rent 6,189 9,514 11,452
Amortization of warrants 7,155 8,100 7,708
Amortization of debt issue costs and guarantee fees 35,752 35,977 24,978
Amortization of bond discount 3,826 3,366 2,894
Amortization of investment discount and premium, net 1,435 899 —
Gain on sale of investments — (3,287) —
Special charges, net (15,432) 14,370 19,055
Other 28,311 6,714 15,801
Changes in operating assets and liabilities:
Decrease (increase) in restricted cash 1,636 (42,900) —
Decrease (increase) in accounts receivable, net (13,337) 4,365 60,009
Decrease (increase) in expendable spare parts and supplies, net 1,012 (2,681) (4,061)
Increase in prepaid expenses (49,286) (45,932) (64,350)
Decrease (increase) in other assets, net (2,635) (254) 5,319
Increase (decrease) in accounts payable (37,120) 9,385 (61,525)
Increase (decrease) in air traffic liability 20,232 4,395 (6,894)
Increase (decrease) in accrued compensation and vacation benefits (18,347) 19,796 (3,050)
Decrease in accrued taxes (3,465) (17,614) (68,909)
Increase (decrease) in other accrued liabilities 6,938 (1,689) 28,348
Increase in other liabilities 1,299 1,294 16,022
Net cash provided by (used in) operating activities 20,642 226,075 (21,287)
Cash flows from investing activities:
Purchases of property and equipment (219,383) (154,365) (157,202)
Purchases of short-term investments (487,505) (633,711) (69,987)
Sales of short-term investments 707,774 364,332 45,249
Purchases of investments in debt securities (35,000) (80,436) —
Sales of investments in debt securities 20,000 10,300 —
Increase in restricted cash (2,215) (23,908) —
Proceeds from sales of aircraft — — 175,478
Proceeds from sales of other property and equipment 32,372 25,826 122
Proceeds from sale of NLG investment — 348 —
Net cash provided by (used in) investing activities 16,043 (491,614) (6,340)
Cash flows from financing activities
Proceeds from issuance of debt 141,354 86,828 435,386
Repayment of debt (175,640) (16,832) (192,596)
Payment of debt issue costs (1,152) (3,236) (36,987)
Other (6,900) (1,750) 2,600
Net cash provided by (used in) financing activities (42,338) 65,010 208,403
Net increase (decrease) in cash and cash equivalents (5,653) (200,529) 180,776
Cash and cash equivalents at beginning of year 134,150 $ 334,679 153,903
Cash and cash equivalents at end of year $ 128,497 $ 134,150 $ 334,679
See accompanying notes to consolidated financial statements.
76