US Airways 2004 Annual Report Download - page 65
Download and view the complete annual report
Please find page 65 of the 2004 US Airways annual report below. You can navigate through the pages in the report by either clicking on the pages listed below, or by using the keyword search tool below to find specific information within the annual report.-
 1
1 -
2
-
3
-
4
-
5
-
6
-
7
-
8
-
9
-
10
-
11
-
12
-
13
-
14
-
15
-
16
-
17
-
18
-
19
-
20
-
21
-
22
-
23
-
24
-
25
-
26
-
27
-
28
-
29
-
30
-
31
-
32
-
33
-
34
-
35
-
36
-
37
-
38
-
39
-
40
-
41
-
42
-
43
-
44
-
45
-
46
-
47
-
48
-
49
-
50
-
51
-
52
-
53
-
54
-
 55
55 -
 56
56 -
 57
57 -
 58
58 -
 59
59 -
 60
60 -
 61
61 -
 62
62 -
 63
63 -
 64
64 -
 65
65 -
 66
66 -
 67
67 -
 68
68 -
 69
69 -
 70
70 -
 71
71 -
 72
72 -
 73
73 -
 74
74 -
 75
75 -
76
-
77
-
78
-
79
-
80
-
81
-
82
-
83
-
84
-
85
-
86
-
87
-
88
-
89
-
90
-
91
-
92
-
93
-
94
-
95
-
96
-
97
-
98
-
99
-
100
-
101
-
102
-
103
-
104
-
105
-
106
-
107
-
108
-
109
-
110
-
111
-
112
-
113
-
114
-
115
-
116
-
117
-
118
-
119
-
120
-
121
-
122
-
123
-
124
-
125
-
126
-
127
-
128
-
129
-
130
-
131
-
132
-
133
-
134
-
135
-
136
-
137
-
138
-
139
-
140
-
141
-
142
-
143
-
144
-
145
-
146
-
147
-
148
-
149
-
150
-
151
-
152
-
153
-
154
-
155
-
156
-
157
-
158
-
159
-
160
-
161
-
162
-
163
-
164
-
165
-
166
-
167
-
168
-
169
-
170
-
171
-
172
-
173
-
174
-
175
-
176
-
177
-
178
-
179
-
180
-
181
-
182
-
183
-
184
-
185
-
186
-
187
-
188
-
189
-
190
-
191
-
192
-
193
-
194
-
195
-
196
-
197
-
198
-
199
-
200
-
201
-
202
-
203
-
204
-
205
-
206
-
207
-
208
-
209
-
210
-
211
-
212
-
213
-
214
-
215
-
216
-
217
-
218
-
219
-
220
-
221
-
222
-
223
-
224
-
225
-
226
-
227
-
228
-
229
-
230
-
231
-
232
-
233
-
234
-
235
-
236
-
237
-
238
-
239
-
240
-
241
-
242
-
243
-
244
-
245
-
246
-
247
-
248
-
249
-
250
-
251
-
252
-
253
-
254
-
255
-
256
-
257
-
258
-
259
-
260
-
261
-
262
-
263
-
264
-
265
-
266
-
267
-
268
-
269
-
270
-
271
-
272
-
273
-
274
-
275
-
276
-
277
-
278
-
279
-
280
-
281
-
282
-
283
-
284
-
285
-
286
-
287
-
288
-
289
-
290
-
291
-
292
-
293
-
294
-
295
-
296
-
297
-
298
-
299
-
300
-
301
-
302
-
303
-
304
-
305
-
306
-
307
-
308
-
309
-
310
-
311
-
312
-
313
-
314
-
315
-
316
-
317
-
318
-
319
-
320
-
321
-
322
-
323
-
324
-
325
-
326
-
327
-
328
-
329
-
330
-
331
-
332
-
333
-
334
-
335
-
336
-
337
-
338
-
339
-
340
-
341
-
342
-
343
-
344
-
345
-
346
 |
 |

Table of Contents
AMERICA WEST HOLDINGS CORPORATION
NOTES TO CONSOLIDATED FINANCIAL STATEMENTS — CONTINUED
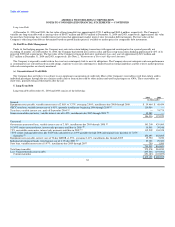
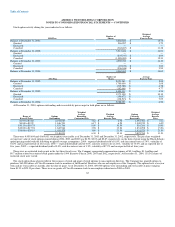
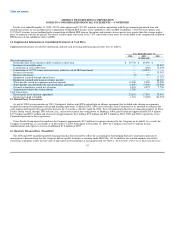
Stock option activity during the years indicated is as follows:
Weighted
Number of Average
1994 Plan Shares Exercise Price
Balance at December 31, 2001: 5,288,886 $ 15.74
Granted 986,987 $ 3.79
Exercised — —
Canceled (362,267) $ 11.38
Balance at December 31, 2002: 5,913,606 $ 14.01
Granted — —
Exercised (235,737) $ 6.09
Canceled (1,088,089) $ 15.33
Balance at December 31, 2003: 4,589,780 $ 14.10
Granted — —
Exercised (23,672) $ 3.80
Canceled (506,046) $ 9.90
Balance at December 31, 2004: 4,060,062 $ 14.69
Number of Average
2002 Plan Shares Exercise Price
Balance at December 31, 2002: 2,021,963 $ 5.00
Granted 1,780,600 $ 3.68
Exercised (215,788) $ 4.78
Canceled (182,661) $ 4.77
Balance at December 31, 2003: 3,404,114 $ 4.34
Granted 1,973,100 $ 10.10
Exercised (150,672) $ 3.63
Canceled (138,513) $ 7.09
Balance at December 31, 2004: 5,088,029 $ 6.52
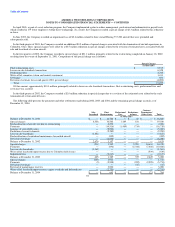
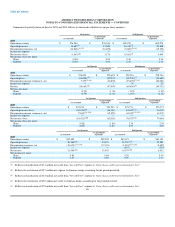
At December 31, 2004, options outstanding and exercisable by price range for both plans are as follows:
Weighted Weighted
Average Weighted Options Average
Range of Options Remaining Average Currently Exercise
Exercise Prices Outstanding Contractual Life Exercise Price Exercisable Price
$1.93 to $3.80 2,192,083 7.82 $ 2.98 1,067,382 $ 3.12
$4.88 to $9.92 1,846,703 6.17 $ 6.28 1,049,239 $ 6.02
$10.13 to $10.75 1,831,766 8.90 $ 10.54 516,266 $ 10.48
$10.82 to $17.94 1,845,964 3.96 $ 13.26 1,831,298 $ 13.26
$18.06 to $29.19 1,431,575 3.80 $ 21.58 1,431,575 $ 21.58
9,148,091 6.30 $ 10.14 5,895,760 $ 11.91
There were 4,959,604 and 4,669,601 stock options exercisable as of December 31, 2003 and December 31, 2002, respectively. The per share weighted-
average fair value of stock options granted during 2004, 2003 and 2002 was $4.50, $2.03 and $2.87, respectively, on the date of grant using the Black-Scholes
option pricing model with the following weighted-average assumptions: 2004 - expected dividend yield of 0.0%, risk-free interest rate of 3.4%, volatility of
54.0% and an expected life of five years; 2003 — expected dividend yield of 0.0%, risk-free interest rate of 2.8%, volatility of 70.4% and an expected life of
five years; 2002 — expected dividend yield of 0.0%, risk-free interest rate of 3.9%, volatility of 87.9% and an expected life of four years.
There were no restricted stock grants in the last three fiscal years. The Company recognized compensation expense of $0.1 million, $1.1 million and
$0.7 million related to restricted stock grants under the 1994 Incentive Plan in 2004, 2003 and 2002, respectively. At December 31, 2004, 135,342 shares of
restricted stock were vested.
The stock option plans also provide for the issuance of stock and grant of stock options to non-employee directors. The Company has granted options to
purchase 563,000 shares of Class B common stock to members of the Board of Directors who are not employees of the Company. The options have a ten-year
term and are exercisable six months after the date of grant. As of December 31, 2004, 409,000 options were outstanding and exercisable at prices ranging
from $1.93 to $29.19 per share. There were no grants of Class B common stock to non-employee directors in 2004 or 2003.
62