US Airways 2004 Annual Report Download - page 30
Download and view the complete annual report
Please find page 30 of the 2004 US Airways annual report below. You can navigate through the pages in the report by either clicking on the pages listed below, or by using the keyword search tool below to find specific information within the annual report.-
 1
1 -
2
-
3
-
4
-
5
-
6
-
7
-
8
-
9
-
10
-
11
-
12
-
13
-
14
-
15
-
16
-
17
-
18
-
19
-
 20
20 -
 21
21 -
 22
22 -
 23
23 -
 24
24 -
 25
25 -
 26
26 -
 27
27 -
 28
28 -
 29
29 -
 30
30 -
 31
31 -
 32
32 -
 33
33 -
 34
34 -
 35
35 -
 36
36 -
 37
37 -
 38
38 -
 39
39 -
 40
40 -
41
-
42
-
43
-
44
-
45
-
46
-
47
-
48
-
49
-
50
-
51
-
52
-
53
-
54
-
55
-
56
-
57
-
58
-
59
-
60
-
61
-
62
-
63
-
64
-
65
-
66
-
67
-
68
-
69
-
70
-
71
-
72
-
73
-
74
-
75
-
76
-
77
-
78
-
79
-
80
-
81
-
82
-
83
-
84
-
85
-
86
-
87
-
88
-
89
-
90
-
91
-
92
-
93
-
94
-
95
-
96
-
97
-
98
-
99
-
100
-
101
-
102
-
103
-
104
-
105
-
106
-
107
-
108
-
109
-
110
-
111
-
112
-
113
-
114
-
115
-
116
-
117
-
118
-
119
-
120
-
121
-
122
-
123
-
124
-
125
-
126
-
127
-
128
-
129
-
130
-
131
-
132
-
133
-
134
-
135
-
136
-
137
-
138
-
139
-
140
-
141
-
142
-
143
-
144
-
145
-
146
-
147
-
148
-
149
-
150
-
151
-
152
-
153
-
154
-
155
-
156
-
157
-
158
-
159
-
160
-
161
-
162
-
163
-
164
-
165
-
166
-
167
-
168
-
169
-
170
-
171
-
172
-
173
-
174
-
175
-
176
-
177
-
178
-
179
-
180
-
181
-
182
-
183
-
184
-
185
-
186
-
187
-
188
-
189
-
190
-
191
-
192
-
193
-
194
-
195
-
196
-
197
-
198
-
199
-
200
-
201
-
202
-
203
-
204
-
205
-
206
-
207
-
208
-
209
-
210
-
211
-
212
-
213
-
214
-
215
-
216
-
217
-
218
-
219
-
220
-
221
-
222
-
223
-
224
-
225
-
226
-
227
-
228
-
229
-
230
-
231
-
232
-
233
-
234
-
235
-
236
-
237
-
238
-
239
-
240
-
241
-
242
-
243
-
244
-
245
-
246
-
247
-
248
-
249
-
250
-
251
-
252
-
253
-
254
-
255
-
256
-
257
-
258
-
259
-
260
-
261
-
262
-
263
-
264
-
265
-
266
-
267
-
268
-
269
-
270
-
271
-
272
-
273
-
274
-
275
-
276
-
277
-
278
-
279
-
280
-
281
-
282
-
283
-
284
-
285
-
286
-
287
-
288
-
289
-
290
-
291
-
292
-
293
-
294
-
295
-
296
-
297
-
298
-
299
-
300
-
301
-
302
-
303
-
304
-
305
-
306
-
307
-
308
-
309
-
310
-
311
-
312
-
313
-
314
-
315
-
316
-
317
-
318
-
319
-
320
-
321
-
322
-
323
-
324
-
325
-
326
-
327
-
328
-
329
-
330
-
331
-
332
-
333
-
334
-
335
-
336
-
337
-
338
-
339
-
340
-
341
-
342
-
343
-
344
-
345
-
346
 |
 |

Table of Contents
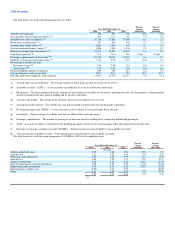
The table below sets forth selected operating data for AWA.
Percent Percent
Year Ended December 31, Change Change
2004 2003 2002 2004-2003 2003-2002
Aircraft (end of period) 138 139 143 (0.7) (2.8)
Average daily aircraft utilization (hours) (a) 10.9 10.1 9.6 7.9 5.2
Available seat miles (in millions) (b) 30,153 27,888 27,008 8.1 3.3
Block hours (in thousands) (c) 557 519 505 7.3 2.8
Average stage length (miles) (d) 1,052 1,005 949 4.7 5.9
Average passenger journey (miles) (e) 1,686 1,564 1,434 7.8 9.1
Revenue passenger miles (in millions) (f) 23,333 21,295 19,878 9.6 7.1
Load factor (percent) (g) 77.4 76.4 73.6 1.0 pts 2.8 pts
Passenger enplanements (in thousands) (h) 21,132 20,050 19,454 5.4 3.1
Yield per revenue passenger mile (cents) (i) 9.41 9.93 9.71 (5.2) 2.3
Revenue per available seat mile:
Passenger (cents) (j) 7.29 7.58 7.14 (3.8) 6.2
Total (cents) (k) 7.75 8.08 7.58 (4.1) 6.6
Fuel consumption (gallons in millions) 450 423 411 6.4 2.9
Average fuel price (cents per gallon) 123.7 88.9 73.0 39.1 21.8
Full-time equivalent employees (end of period) 11,893 11,475 12,111 3.6 (5.3)
(a) Average daily aircraft utilization – The average number of block hours per day for all aircraft in service.
(b) Available seat mile ("ASM") – A basic measure of production. It is one seat flown one statute mile.
(c) Block hours – The hours measured from the moment an aircraft first moves under its own power, including taxi time, for the purposes of flight until the
aircraft is docked at the next point of landing and its power is shut down.
(d) Average stage length – The average of the distances flown on each segment of every route.
(e) Average passenger journey – The average one-way trip measured in statute miles for one passenger origination.
(f) Revenue passenger mile ("RPM") – A basic measure of sales volume. It is one passenger flown one mile.
(g) Load factor – The percentage of available seats that are filled with revenue passengers.
(h) Passenger enplanements – The number of passengers on board an aircraft including local, connecting and through passengers.
(i) Yield – A measure of airline revenue derived by dividing passenger revenue by revenue passenger miles and expressed in cents per mile.
(j) Passenger revenue per available seat mile ("RASM") – Total passenger revenues divided by total available seat miles.
(k) Total revenue per available seat mile – Total operating revenues divided by total available seat miles.
The table below sets forth the major components of CASM for AWA for the applicable years.
Percent Percent
Year Ended December 31, Change Change
2004 2003 2002 2004-2003 2003-2002
(in cents)
Salaries and related costs 2.17 2.36 2.23 (7.9) 5.9
Aircraft rents 1.01 1.07 1.09 (5.4) (2.3)
Other rents and landing fees 0.56 0.55 0.59 0.4 (5.4)
Aircraft fuel 1.85 1.35 1.11 37.0 21.7
Agency commissions 0.08 0.12 0.18 (32.4) (33.2)
Aircraft maintenance materials and repairs 0.68 0.80 0.94 (14.8) (14.4)
Depreciation and amortization 0.18 0.24 0.28 (24.8) (13.9)
Special charges (credits), net (0.05) 0.06 0.07 — (26.9)
Other 1.41 1.44 1.67 (2.6) (13.6)
7.89 7.99 8.16 (1.3) (2.1)
27