US Airways 2004 Annual Report Download - page 33
Download and view the complete annual report
Please find page 33 of the 2004 US Airways annual report below. You can navigate through the pages in the report by either clicking on the pages listed below, or by using the keyword search tool below to find specific information within the annual report.-
 1
1 -
2
-
3
-
4
-
5
-
6
-
7
-
8
-
9
-
10
-
11
-
12
-
13
-
14
-
15
-
16
-
17
-
18
-
19
-
20
-
21
-
22
-
 23
23 -
 24
24 -
 25
25 -
 26
26 -
 27
27 -
 28
28 -
 29
29 -
 30
30 -
 31
31 -
 32
32 -
 33
33 -
 34
34 -
 35
35 -
 36
36 -
 37
37 -
 38
38 -
 39
39 -
 40
40 -
 41
41 -
 42
42 -
 43
43 -
44
-
45
-
46
-
47
-
48
-
49
-
50
-
51
-
52
-
53
-
54
-
55
-
56
-
57
-
58
-
59
-
60
-
61
-
62
-
63
-
64
-
65
-
66
-
67
-
68
-
69
-
70
-
71
-
72
-
73
-
74
-
75
-
76
-
77
-
78
-
79
-
80
-
81
-
82
-
83
-
84
-
85
-
86
-
87
-
88
-
89
-
90
-
91
-
92
-
93
-
94
-
95
-
96
-
97
-
98
-
99
-
100
-
101
-
102
-
103
-
104
-
105
-
106
-
107
-
108
-
109
-
110
-
111
-
112
-
113
-
114
-
115
-
116
-
117
-
118
-
119
-
120
-
121
-
122
-
123
-
124
-
125
-
126
-
127
-
128
-
129
-
130
-
131
-
132
-
133
-
134
-
135
-
136
-
137
-
138
-
139
-
140
-
141
-
142
-
143
-
144
-
145
-
146
-
147
-
148
-
149
-
150
-
151
-
152
-
153
-
154
-
155
-
156
-
157
-
158
-
159
-
160
-
161
-
162
-
163
-
164
-
165
-
166
-
167
-
168
-
169
-
170
-
171
-
172
-
173
-
174
-
175
-
176
-
177
-
178
-
179
-
180
-
181
-
182
-
183
-
184
-
185
-
186
-
187
-
188
-
189
-
190
-
191
-
192
-
193
-
194
-
195
-
196
-
197
-
198
-
199
-
200
-
201
-
202
-
203
-
204
-
205
-
206
-
207
-
208
-
209
-
210
-
211
-
212
-
213
-
214
-
215
-
216
-
217
-
218
-
219
-
220
-
221
-
222
-
223
-
224
-
225
-
226
-
227
-
228
-
229
-
230
-
231
-
232
-
233
-
234
-
235
-
236
-
237
-
238
-
239
-
240
-
241
-
242
-
243
-
244
-
245
-
246
-
247
-
248
-
249
-
250
-
251
-
252
-
253
-
254
-
255
-
256
-
257
-
258
-
259
-
260
-
261
-
262
-
263
-
264
-
265
-
266
-
267
-
268
-
269
-
270
-
271
-
272
-
273
-
274
-
275
-
276
-
277
-
278
-
279
-
280
-
281
-
282
-
283
-
284
-
285
-
286
-
287
-
288
-
289
-
290
-
291
-
292
-
293
-
294
-
295
-
296
-
297
-
298
-
299
-
300
-
301
-
302
-
303
-
304
-
305
-
306
-
307
-
308
-
309
-
310
-
311
-
312
-
313
-
314
-
315
-
316
-
317
-
318
-
319
-
320
-
321
-
322
-
323
-
324
-
325
-
326
-
327
-
328
-
329
-
330
-
331
-
332
-
333
-
334
-
335
-
336
-
337
-
338
-
339
-
340
-
341
-
342
-
343
-
344
-
345
-
346
 |
 |

Table of Contents
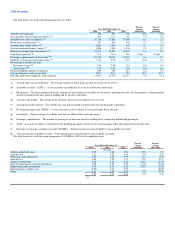
• Other rents and landing fees expense per ASM decreased 5.4% primarily due to lower costs for borrowed parts ($5.6 million) and other space rental
($1.3 million). This decrease was offset in part by higher airport rent ($1.5 million) and landing fees ($1.4 million).
• Aircraft jet fuel expense per ASM increased 21.7% primarily due to a 21.8% increase in the average price per gallon of fuel to 88.9 cents in 2003
from 73.0 cents in 2002.
• Agency commissions expense per ASM decreased 33.2% primarily due to the elimination of base commissions for travel agency tickets issued in the
United States, effective March 21, 2002, subsequent reductions in various travel agency incentive programs and lower override commissions.
• Aircraft maintenance materials and repair expense per ASM decreased 14.4% primarily due to lower aircraft C-Check ($10.1 million), airframe
maintenance ($3.1 million), and engine overhaul ($2.9 million) expenses and the 3.3% increase in ASMs. In addition, a change in the estimated
useful life of certain aircraft engine overhaul costs, effective April 1, 2003 and driven by a new maintenance agreement that guarantees minimum
cycles on engine overhauls, resulted in a $12.7 million reduction in capitalized maintenance amortization expense (see Note 1, "Summary of
Significant Accounting Policies – (e) Aircraft Maintenance and Repairs" in AWA's Notes to Consolidated Financial Statements) offset by a
$0.9 million penalty for the return of two spare engines in 2003.
• Depreciation and amortization expense per ASM decreased 13.9% due primarily to reduced capital expenditures as a result of the Company's cash
conservation program and the 3.3% increase in ASMs. Decreases in computer hardware, software and facility improvements ($4.5 million), aircraft
leasehold improvement amortization ($2.9 million) and depreciation expense for owned aircraft ($2.0 million) were offset in part by an increase in
depreciation expense for rotable aircraft parts ($0.9 million).
• Other operating expenses per ASM decreased 13.6% from 1.67 cents to 1.44 cents primarily due to decreases in traffic liability insurance
($11.6 million), computer reservations system booking fees ($7.7 million), security services ($6.0 million), FlightFund expense ($5.2 million), bad
debt expense ($5.2 million) and the 3.3% increase in ASMs. These decreases were offset in part by increased credit card fees ($6.2 million). In
addition, the 2003 period includes a $4.4 million gain related to the purchase and subsequent exchange of an A320 airframe and a $2.8 million credit
related to the settlement of disputed billings under the Company's frequent flyer program.
AWA had net nonoperating income of $35.3 million in 2003 compared to $55.8 million of net nonoperating expenses in 2002. The 2003 period benefited
from $81.3 million of federal government assistance received under the Emergency Wartime Supplemental Appropriations Act. See Note 16, "Emergency
Wartime Supplemental Appropriations Act" in AWA's Notes to Consolidated Financial Statements. Interest expense increased $7.2 million in 2003 due to
higher average outstanding debt while interest income decreased $4.3 million primarily due to lower interest rates in 2003 compared to 2002. The 2003 period
also includes a $9.8 million gain related to the sale of an investment in Hotwire.com. See Note 12, "Nonoperating Income (Expenses) – Other, Net" in AWA's
Notes to Consolidated Financial Statements. The 2002 period included $8.5 million of federal government assistance received under the Air Transportation
Safety and System Stabilization Act and a $2.8 million charge related to the write-off of AWA's investment in an e-commerce entity. The changes in the fair
value of the Company's derivative instruments and the net realized gains and losses for the settled hedge transactions was a $10.7 million credit in 2003
compared to $0.7 million expense in the 2002 period.
Liquidity and Capital Resources
Sources and Uses of Cash
At December 31, 2004, Holdings' and AWA's total cash, cash equivalents, short-term investments, investments in debt securities and restricted cash
balances were $419.1 million and $398.5 million, respectively. Net cash provided by operating activities for Holdings and AWA was $20.8 million and
$20.6 million, respectively, in 2004. This compares to net cash provided by operating activities of $241.8 million and $226.1 million for Holdings and AWA,
respectively, in 2003. The year-over-year decrease in net cash provided by operating activities of $221.0 million and $205.4 million for Holdings and AWA,
respectively, was primarily due to the loss in the 2004 period and the receipt of $81.3 million of refunded security fees from the Federal government in 2003.
30