US Airways 2004 Annual Report Download - page 78
Download and view the complete annual report
Please find page 78 of the 2004 US Airways annual report below. You can navigate through the pages in the report by either clicking on the pages listed below, or by using the keyword search tool below to find specific information within the annual report.-
 1
1 -
2
-
3
-
4
-
5
-
6
-
7
-
8
-
9
-
10
-
11
-
12
-
13
-
14
-
15
-
16
-
17
-
18
-
19
-
20
-
21
-
22
-
23
-
24
-
25
-
26
-
27
-
28
-
29
-
30
-
31
-
32
-
33
-
34
-
35
-
36
-
37
-
38
-
39
-
40
-
41
-
42
-
43
-
44
-
45
-
46
-
47
-
48
-
49
-
50
-
51
-
52
-
53
-
54
-
55
-
56
-
57
-
58
-
59
-
60
-
61
-
62
-
63
-
64
-
65
-
66
-
67
-
 68
68 -
 69
69 -
 70
70 -
 71
71 -
 72
72 -
 73
73 -
 74
74 -
 75
75 -
 76
76 -
 77
77 -
 78
78 -
 79
79 -
 80
80 -
 81
81 -
 82
82 -
 83
83 -
 84
84 -
 85
85 -
 86
86 -
 87
87 -
 88
88 -
89
-
90
-
91
-
92
-
93
-
94
-
95
-
96
-
97
-
98
-
99
-
100
-
101
-
102
-
103
-
104
-
105
-
106
-
107
-
108
-
109
-
110
-
111
-
112
-
113
-
114
-
115
-
116
-
117
-
118
-
119
-
120
-
121
-
122
-
123
-
124
-
125
-
126
-
127
-
128
-
129
-
130
-
131
-
132
-
133
-
134
-
135
-
136
-
137
-
138
-
139
-
140
-
141
-
142
-
143
-
144
-
145
-
146
-
147
-
148
-
149
-
150
-
151
-
152
-
153
-
154
-
155
-
156
-
157
-
158
-
159
-
160
-
161
-
162
-
163
-
164
-
165
-
166
-
167
-
168
-
169
-
170
-
171
-
172
-
173
-
174
-
175
-
176
-
177
-
178
-
179
-
180
-
181
-
182
-
183
-
184
-
185
-
186
-
187
-
188
-
189
-
190
-
191
-
192
-
193
-
194
-
195
-
196
-
197
-
198
-
199
-
200
-
201
-
202
-
203
-
204
-
205
-
206
-
207
-
208
-
209
-
210
-
211
-
212
-
213
-
214
-
215
-
216
-
217
-
218
-
219
-
220
-
221
-
222
-
223
-
224
-
225
-
226
-
227
-
228
-
229
-
230
-
231
-
232
-
233
-
234
-
235
-
236
-
237
-
238
-
239
-
240
-
241
-
242
-
243
-
244
-
245
-
246
-
247
-
248
-
249
-
250
-
251
-
252
-
253
-
254
-
255
-
256
-
257
-
258
-
259
-
260
-
261
-
262
-
263
-
264
-
265
-
266
-
267
-
268
-
269
-
270
-
271
-
272
-
273
-
274
-
275
-
276
-
277
-
278
-
279
-
280
-
281
-
282
-
283
-
284
-
285
-
286
-
287
-
288
-
289
-
290
-
291
-
292
-
293
-
294
-
295
-
296
-
297
-
298
-
299
-
300
-
301
-
302
-
303
-
304
-
305
-
306
-
307
-
308
-
309
-
310
-
311
-
312
-
313
-
314
-
315
-
316
-
317
-
318
-
319
-
320
-
321
-
322
-
323
-
324
-
325
-
326
-
327
-
328
-
329
-
330
-
331
-
332
-
333
-
334
-
335
-
336
-
337
-
338
-
339
-
340
-
341
-
342
-
343
-
344
-
345
-
346
 |
 |

Table of Contents
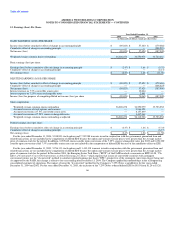
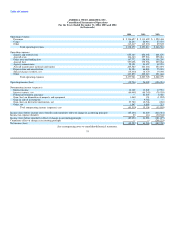
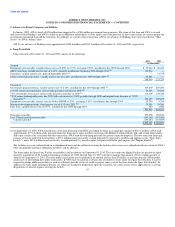
AMERICA WEST AIRLINES, INC.
Consolidated Statements of Operations
For the Years Ended December 31, 2004, 2003 and 2002
(in thousands)
2004 2003 2002
Operating revenues:
Passenger $ 2,196,627 $ 2,113,629 $ 1,929,444
Cargo 28,233 26,914 27,574
Other 113,417 113,274 89,545
Total operating revenues 2,338,277 2,253,817 2,046,563
Operating expenses:
Salaries and related costs 655,185 658,042 601,870
Aircraft rents 304,343 297,518 295,016
Other rents and landing fees 167,772 154,598 158,290
Aircraft fuel 557,098 375,996 299,284
Agency commissions 25,191 34,457 49,953
Aircraft maintenance materials and repairs 205,580 223,266 252,691
Depreciation and amortization 54,354 66,865 75,201
Special charges (credits), net (15,432) 14,370 19,030
Other 423,890 402,613 451,444
Total operating expenses 2,377,981 2,227,725 2,202,779
Operating income (loss) (39,704) 26,092 (156,216)
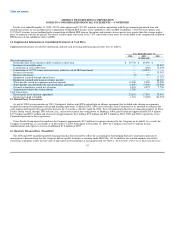
Nonoperating income (expenses):
Interest income 14,169 13,249 17,551
Interest expense, net (86,488) (86,743) (79,529)
Federal government assistance — 81,255 8,466
Gain (loss) on disposition of property and equipment 1,460 151 (1,852)
Gain on sale of investments — 9,762 —
Gain (loss) on derivative instruments, net 23,782 10,746 (656)
Other, net 1,547 6,888 215
Total nonoperating income (expenses), net (45,530) 35,308 (55,805)
Income (loss) before income taxes (benefit) and cumulative effect of change in accounting principle (85,234) 61,400 (212,021)
Income tax expense (benefit) 23 114 (30,544)
Income (loss) before cumulative effect of change in accounting principle (85,257) 61,286 (181,477)
Cumulative effect of change in accounting principle — — (208,223)
Net income (loss) $ (85,257) $ 61,286 $ (389,700)
See accompanying notes to consolidated financial statements.
75