US Airways 2004 Annual Report Download - page 5
Download and view the complete annual report
Please find page 5 of the 2004 US Airways annual report below. You can navigate through the pages in the report by either clicking on the pages listed below, or by using the keyword search tool below to find specific information within the annual report.-
 1
1 -
 2
2 -
 3
3 -
 4
4 -
 5
5 -
 6
6 -
 7
7 -
 8
8 -
 9
9 -
 10
10 -
 11
11 -
 12
12 -
 13
13 -
 14
14 -
 15
15 -
 16
16 -
 17
17 -
 18
18 -
 19
19 -
 20
20 -
 21
21 -
 22
22 -
 23
23 -
 24
24 -
 25
25 -
 26
26 -
 27
27 -
 28
28 -
 29
29 -
 30
30 -
 31
31 -
 32
32 -
 33
33 -
 34
34 -
 35
35 -
 36
36 -
 37
37 -
 38
38 -
 39
39 -
 40
40 -
 41
41 -
 42
42 -
 43
43 -
 44
44 -
 45
45 -
 46
46 -
 47
47 -
 48
48 -
 49
49 -
 50
50 -
 51
51 -
 52
52 -
 53
53 -
 54
54 -
 55
55 -
 56
56 -
 57
57 -
 58
58 -
 59
59 -
 60
60 -
 61
61 -
 62
62 -
 63
63 -
 64
64 -
 65
65 -
 66
66 -
 67
67 -
 68
68 -
 69
69 -
 70
70 -
 71
71 -
 72
72 -
 73
73 -
 74
74 -
 75
75 -
 76
76 -
 77
77 -
 78
78 -
 79
79 -
 80
80 -
 81
81 -
 82
82 -
 83
83 -
 84
84 -
 85
85 -
 86
86 -
 87
87 -
 88
88 -
 89
89 -
 90
90 -
 91
91 -
 92
92 -
 93
93 -
 94
94 -
 95
95 -
 96
96 -
 97
97 -
 98
98 -
 99
99 -
 100
100 -
 101
101 -
 102
102 -
 103
103 -
 104
104 -
 105
105 -
 106
106 -
 107
107 -
 108
108 -
 109
109 -
 110
110 -
 111
111 -
 112
112 -
 113
113 -
 114
114 -
 115
115 -
 116
116 -
 117
117 -
 118
118 -
 119
119 -
 120
120 -
 121
121 -
 122
122 -
 123
123 -
 124
124 -
 125
125 -
 126
126 -
 127
127 -
 128
128 -
 129
129 -
 130
130 -
 131
131 -
 132
132 -
 133
133 -
 134
134 -
 135
135 -
 136
136 -
 137
137 -
 138
138 -
 139
139 -
 140
140 -
 141
141 -
 142
142 -
 143
143 -
 144
144 -
 145
145 -
 146
146 -
 147
147 -
 148
148 -
 149
149 -
 150
150 -
 151
151 -
 152
152 -
 153
153 -
 154
154 -
 155
155 -
 156
156 -
 157
157 -
 158
158 -
 159
159 -
 160
160 -
 161
161 -
 162
162 -
 163
163 -
 164
164 -
 165
165 -
 166
166 -
 167
167 -
 168
168 -
 169
169 -
 170
170 -
 171
171 -
 172
172 -
 173
173 -
 174
174 -
 175
175 -
 176
176 -
 177
177 -
 178
178 -
 179
179 -
 180
180 -
 181
181 -
 182
182 -
 183
183 -
 184
184 -
 185
185 -
 186
186 -
 187
187 -
 188
188 -
 189
189 -
 190
190 -
 191
191 -
 192
192 -
 193
193 -
 194
194 -
 195
195 -
 196
196 -
 197
197 -
 198
198 -
 199
199 -
 200
200 -
 201
201 -
 202
202 -
 203
203 -
 204
204 -
 205
205 -
 206
206 -
 207
207 -
 208
208 -
 209
209 -
 210
210 -
 211
211 -
 212
212 -
 213
213 -
 214
214 -
 215
215 -
 216
216 -
 217
217 -
 218
218 -
 219
219 -
 220
220 -
 221
221 -
 222
222 -
 223
223 -
 224
224 -
 225
225 -
 226
226 -
 227
227 -
 228
228 -
 229
229 -
 230
230 -
 231
231 -
 232
232 -
 233
233 -
 234
234 -
 235
235 -
 236
236 -
 237
237 -
 238
238 -
 239
239 -
 240
240 -
 241
241 -
 242
242 -
 243
243 -
 244
244 -
 245
245 -
 246
246 -
 247
247 -
 248
248 -
 249
249 -
 250
250 -
 251
251 -
 252
252 -
 253
253 -
 254
254 -
 255
255 -
 256
256 -
 257
257 -
 258
258 -
 259
259 -
 260
260 -
 261
261 -
 262
262 -
 263
263 -
 264
264 -
 265
265 -
 266
266 -
 267
267 -
 268
268 -
 269
269 -
 270
270 -
 271
271 -
 272
272 -
 273
273 -
 274
274 -
 275
275 -
 276
276 -
 277
277 -
 278
278 -
 279
279 -
 280
280 -
 281
281 -
 282
282 -
 283
283 -
 284
284 -
 285
285 -
 286
286 -
 287
287 -
 288
288 -
 289
289 -
 290
290 -
 291
291 -
 292
292 -
 293
293 -
 294
294 -
 295
295 -
 296
296 -
 297
297 -
 298
298 -
 299
299 -
 300
300 -
 301
301 -
 302
302 -
 303
303 -
 304
304 -
 305
305 -
 306
306 -
 307
307 -
 308
308 -
 309
309 -
 310
310 -
 311
311 -
 312
312 -
 313
313 -
 314
314 -
 315
315 -
 316
316 -
 317
317 -
 318
318 -
 319
319 -
 320
320 -
 321
321 -
 322
322 -
 323
323 -
 324
324 -
 325
325 -
 326
326 -
 327
327 -
 328
328 -
 329
329 -
 330
330 -
 331
331 -
 332
332 -
 333
333 -
 334
334 -
 335
335 -
 336
336 -
 337
337 -
 338
338 -
 339
339 -
 340
340 -
 341
341 -
 342
342 -
 343
343 -
 344
344 -
 345
345 -
 346
346
 |
 |

Table of Contents
PART I
ITEM 1. BUSINESS
Overview
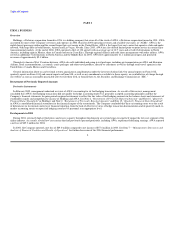
Holdings, a Delaware corporation formed in 1996, is a holding company that owns all of the stock of AWA, a Delaware corporation formed in 1981. AWA
accounted for most of the Company's revenues and expenses in 2004. Based on 2004 operating revenues and available seat miles, or "ASMs", AWA is the
eighth largest passenger airline and the second largest low cost carrier in the United States. AWA is the largest low-cost carrier that operates a hub-and-spoke
network, with large hubs in both Phoenix, Arizona and Las Vegas, Nevada. Since 2003, AWA has also offered limited point-to-point service in certain major
transcontinental markets. At the end of 2004, AWA operated a fleet of 138 aircraft with an average age of 10.7 years and served 63 destinations in North
America, including eight in Mexico, three in Canada and one in Costa Rica. Through regional alliance and code share arrangements with other airlines, AWA
served an additional 51 destinations in North America and the Middle East. In 2004, AWA flew approximately 21.1 million passengers and generated
revenues of approximately $2.3 billion.
Through its America West Vacations division, AWA also sells individual and group travel packages, including air transportation on AWA and Hawaiian
Airlines, hotel accommodations, car rentals, cruise packages and other travel products, directly to consumers as well as through retail travel agencies in the
United States, Canada, Mexico and Costa Rica.
General information about us can be found at www.americawest.com/aboutawa under the investor relations link. Our annual reports on Form 10-K,
quarterly reports on Form 10-Q and current reports on Form 8-K, as well as any amendments or exhibits to those reports, are available free of charge through
our website as soon as reasonably practicable after we file them with, or furnish them to, the Securities and Exchange Commission or "SEC."
Restatement of Previously Reported Amounts
Derivative Instruments
In February 2005, management undertook a review of AWA's accounting for its fuel hedging transactions. As a result of this review, management
concluded that AWA's fuel hedging transactions did not qualify for hedge accounting under U.S. generally accepted accounting principles and that the
Company's financial statements for prior periods required restatement to reflect the fair value of fuel hedging contracts in the balance sheets and statements of
stockholders equity and comprehensive income of Holdings and AWA. See Note 2, "Restatement of Previously Reported Amounts" and Note 16, "Quarterly
Financial Data (Unaudited)" in Holdings' and Note 2, "Restatement of Previously Reported Amounts" and Note 15, "Quarterly Financial Data (Unaudited)"
in AWA's consolidated financial statements for the financial impact of the restatements. The Company concluded that these accounting errors were the result
of deficiencies in its internal control over financial reporting, from the lack of effective reviews of hedge transaction documentation and of quarterly mark-to-
market accounting entries on open fuel hedging contracts by personnel at an appropriate level.
Developments in 2004
During 2004, extremely high jet fuel prices and excess capacity throughout the domestic air system began to negatively impact the low cost segment of the
airline industry. As a result, several low cost carriers that had previously operated profitably, including AWA, experienced declining earnings. AWA reported
a net loss of $85.3 million for 2004.
In 2004, the Company reported a net loss of $89.0 million compared to net income of $57.4 million in 2003. See Item 7 – "Management's Discussion and
Analysis of Financial Condition and Results of Operations" for further discussion of the 2004 financial performance.
2
