US Airways 2004 Annual Report Download - page 71
Download and view the complete annual report
Please find page 71 of the 2004 US Airways annual report below. You can navigate through the pages in the report by either clicking on the pages listed below, or by using the keyword search tool below to find specific information within the annual report.-
 1
1 -
2
-
3
-
4
-
5
-
6
-
7
-
8
-
9
-
10
-
11
-
12
-
13
-
14
-
15
-
16
-
17
-
18
-
19
-
20
-
21
-
22
-
23
-
24
-
25
-
26
-
27
-
28
-
29
-
30
-
31
-
32
-
33
-
34
-
35
-
36
-
37
-
38
-
39
-
40
-
41
-
42
-
43
-
44
-
45
-
46
-
47
-
48
-
49
-
50
-
51
-
52
-
53
-
54
-
55
-
56
-
57
-
58
-
59
-
60
-
 61
61 -
 62
62 -
 63
63 -
 64
64 -
 65
65 -
 66
66 -
 67
67 -
 68
68 -
 69
69 -
 70
70 -
 71
71 -
 72
72 -
 73
73 -
 74
74 -
 75
75 -
 76
76 -
 77
77 -
 78
78 -
 79
79 -
 80
80 -
 81
81 -
82
-
83
-
84
-
85
-
86
-
87
-
88
-
89
-
90
-
91
-
92
-
93
-
94
-
95
-
96
-
97
-
98
-
99
-
100
-
101
-
102
-
103
-
104
-
105
-
106
-
107
-
108
-
109
-
110
-
111
-
112
-
113
-
114
-
115
-
116
-
117
-
118
-
119
-
120
-
121
-
122
-
123
-
124
-
125
-
126
-
127
-
128
-
129
-
130
-
131
-
132
-
133
-
134
-
135
-
136
-
137
-
138
-
139
-
140
-
141
-
142
-
143
-
144
-
145
-
146
-
147
-
148
-
149
-
150
-
151
-
152
-
153
-
154
-
155
-
156
-
157
-
158
-
159
-
160
-
161
-
162
-
163
-
164
-
165
-
166
-
167
-
168
-
169
-
170
-
171
-
172
-
173
-
174
-
175
-
176
-
177
-
178
-
179
-
180
-
181
-
182
-
183
-
184
-
185
-
186
-
187
-
188
-
189
-
190
-
191
-
192
-
193
-
194
-
195
-
196
-
197
-
198
-
199
-
200
-
201
-
202
-
203
-
204
-
205
-
206
-
207
-
208
-
209
-
210
-
211
-
212
-
213
-
214
-
215
-
216
-
217
-
218
-
219
-
220
-
221
-
222
-
223
-
224
-
225
-
226
-
227
-
228
-
229
-
230
-
231
-
232
-
233
-
234
-
235
-
236
-
237
-
238
-
239
-
240
-
241
-
242
-
243
-
244
-
245
-
246
-
247
-
248
-
249
-
250
-
251
-
252
-
253
-
254
-
255
-
256
-
257
-
258
-
259
-
260
-
261
-
262
-
263
-
264
-
265
-
266
-
267
-
268
-
269
-
270
-
271
-
272
-
273
-
274
-
275
-
276
-
277
-
278
-
279
-
280
-
281
-
282
-
283
-
284
-
285
-
286
-
287
-
288
-
289
-
290
-
291
-
292
-
293
-
294
-
295
-
296
-
297
-
298
-
299
-
300
-
301
-
302
-
303
-
304
-
305
-
306
-
307
-
308
-
309
-
310
-
311
-
312
-
313
-
314
-
315
-
316
-
317
-
318
-
319
-
320
-
321
-
322
-
323
-
324
-
325
-
326
-
327
-
328
-
329
-
330
-
331
-
332
-
333
-
334
-
335
-
336
-
337
-
338
-
339
-
340
-
341
-
342
-
343
-
344
-
345
-
346
 |
 |

Table of Contents
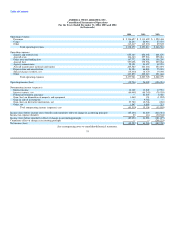
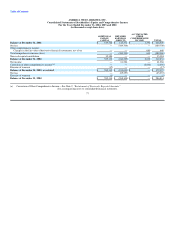
AMERICA WEST HOLDINGS CORPORATION
NOTES TO CONSOLIDATED FINANCIAL STATEMENTS — CONTINUED
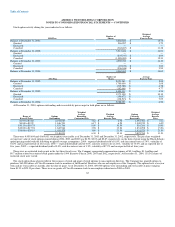
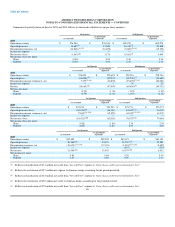
Summarized quarterly financial data for 2004 and 2003 follows (in thousands of dollars except per share amounts):
1st Quarter 2nd Quarter
(as previously (as previously
(as restated) reported) (as restated) reported)
2004
Operating revenues $ 576,544 $ 576,544 $ 605,074 $ 605,074
Operating income 14,685(1) 17,828 16,330(3) 20,848
Nonoperating expenses, net (16,248)(1) (2) (16,652) (5,669)(3) (4) (15,154)
Income tax expense — — — —
Net income (loss) (1,563)(2) 1,176 10,661(4) 5,694
Net income (loss) per share:
Basic (0.04) 0.03 0.30 0.16
Diluted (0.03) 0.02 0.20 0.11
3rd Quarter 4th Quarter
(as previously (as previously
(as restated) reported) (as restated) reported)
2004
Operating revenues $ 578,623 $ 578,623 $ 578,716 $ 578,716
Operating loss (36,038)(5) (28,237) (38,748)(7) (23,681)
Nonoperating income (expenses), net 7,373(5) (6) (18,830) (30,678)(7) (8) (26,001)
Income tax expense — — 30 30
Net loss (28,665)(6) (47,067) (69,456)(8) (49,712)
Net loss per share:
Basic (0.79) (1.30) (1.92) (1.38)
Diluted (0.79) (1.30) (1.92) (1.38)
1st Quarter 2nd Quarter
(as previously (as previously
(as restated) reported) (as restated) reported)
2003
Operating revenues $ 523,233 $ 523,233 $ 575,771 $ 575,771
Operating income (loss) (56,376)(9) (46,140) 16,447(11) 16,305
Nonoperating income (expenses), net (7,045)(9) (10) (15,878) 62,425(11) (12) 63,379
Income tax expense — — — —
Net income (loss) (63,421)(10) (62,018) 78,872(12) 79,684
Net income (loss) per share:
Basic (1.88) (1.84) 2.34 2.36
Diluted (1.88) (1.84) 2.00 2.02
3rd Quarter 4th Quarter
(as previously (as previously
(as restated) reported) (as restated) reported)
2003
Operating revenues $ 592,302 $ 592,302 $ 563,191 $ 563,191
Operating income 50,268(13) 50,135 11,796(15) 12,581
Nonoperating expenses, net (18,678)(13) (14) (17,193) (1,303)(15) (16) (5,655)
Income tax expense — — (114) (114)
Net income 31,590(14) 32,942 10,379(16) 6,812
Net income per share:
Basic 0.90 0.94 0.29 0.19
Diluted 0.53 0.60 0.19 0.13
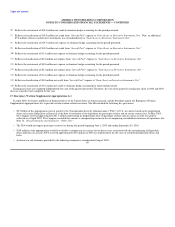
(1) Reflects reclassification of $3.1 million net credit from "Aircraft Fuel" expense to "Gain (Loss) on Derivative Instruments, Net."
(2) Reflects the restatement of $2.7 million net expense to eliminate hedge accounting for the period presented.
(3) Reflects reclassification of $4.5 million net credit from "Aircraft Fuel" expense to "Gain (Loss) on Derivative Instruments, Net."
(4) Reflects the restatement of $5.0 million net credit to eliminate hedge accounting for the period presented.
(5) Reflects reclassification of $7.8 million net credit from "Aircraft Fuel" expense to "Gain (Loss) on Derivative Instruments, Net."
68