US Airways 2004 Annual Report Download - page 48
Download and view the complete annual report
Please find page 48 of the 2004 US Airways annual report below. You can navigate through the pages in the report by either clicking on the pages listed below, or by using the keyword search tool below to find specific information within the annual report.-
 1
1 -
 2
2 -
 3
3 -
 4
4 -
 5
5 -
 6
6 -
 7
7 -
 8
8 -
 9
9 -
 10
10 -
 11
11 -
 12
12 -
 13
13 -
 14
14 -
 15
15 -
 16
16 -
 17
17 -
 18
18 -
 19
19 -
 20
20 -
 21
21 -
 22
22 -
 23
23 -
 24
24 -
 25
25 -
 26
26 -
 27
27 -
 28
28 -
 29
29 -
 30
30 -
 31
31 -
 32
32 -
 33
33 -
 34
34 -
 35
35 -
 36
36 -
 37
37 -
 38
38 -
 39
39 -
 40
40 -
 41
41 -
 42
42 -
 43
43 -
 44
44 -
 45
45 -
 46
46 -
 47
47 -
 48
48 -
 49
49 -
 50
50 -
 51
51 -
 52
52 -
 53
53 -
 54
54 -
 55
55 -
 56
56 -
 57
57 -
 58
58 -
 59
59 -
 60
60 -
 61
61 -
 62
62 -
 63
63 -
 64
64 -
 65
65 -
 66
66 -
 67
67 -
 68
68 -
 69
69 -
 70
70 -
 71
71 -
 72
72 -
 73
73 -
 74
74 -
 75
75 -
 76
76 -
 77
77 -
 78
78 -
 79
79 -
 80
80 -
 81
81 -
 82
82 -
 83
83 -
 84
84 -
 85
85 -
 86
86 -
 87
87 -
 88
88 -
 89
89 -
 90
90 -
 91
91 -
 92
92 -
 93
93 -
 94
94 -
 95
95 -
 96
96 -
 97
97 -
 98
98 -
 99
99 -
 100
100 -
 101
101 -
 102
102 -
 103
103 -
 104
104 -
 105
105 -
 106
106 -
 107
107 -
 108
108 -
 109
109 -
 110
110 -
 111
111 -
 112
112 -
 113
113 -
 114
114 -
 115
115 -
 116
116 -
 117
117 -
 118
118 -
 119
119 -
 120
120 -
 121
121 -
 122
122 -
 123
123 -
 124
124 -
 125
125 -
 126
126 -
 127
127 -
 128
128 -
 129
129 -
 130
130 -
 131
131 -
 132
132 -
 133
133 -
 134
134 -
 135
135 -
 136
136 -
 137
137 -
 138
138 -
 139
139 -
 140
140 -
 141
141 -
 142
142 -
 143
143 -
 144
144 -
 145
145 -
 146
146 -
 147
147 -
 148
148 -
 149
149 -
 150
150 -
 151
151 -
 152
152 -
 153
153 -
 154
154 -
 155
155 -
 156
156 -
 157
157 -
 158
158 -
 159
159 -
 160
160 -
 161
161 -
 162
162 -
 163
163 -
 164
164 -
 165
165 -
 166
166 -
 167
167 -
 168
168 -
 169
169 -
 170
170 -
 171
171 -
 172
172 -
 173
173 -
 174
174 -
 175
175 -
 176
176 -
 177
177 -
 178
178 -
 179
179 -
 180
180 -
 181
181 -
 182
182 -
 183
183 -
 184
184 -
 185
185 -
 186
186 -
 187
187 -
 188
188 -
 189
189 -
 190
190 -
 191
191 -
 192
192 -
 193
193 -
 194
194 -
 195
195 -
 196
196 -
 197
197 -
 198
198 -
 199
199 -
 200
200 -
 201
201 -
 202
202 -
 203
203 -
 204
204 -
 205
205 -
 206
206 -
 207
207 -
 208
208 -
 209
209 -
 210
210 -
 211
211 -
 212
212 -
 213
213 -
 214
214 -
 215
215 -
 216
216 -
 217
217 -
 218
218 -
 219
219 -
 220
220 -
 221
221 -
 222
222 -
 223
223 -
 224
224 -
 225
225 -
 226
226 -
 227
227 -
 228
228 -
 229
229 -
 230
230 -
 231
231 -
 232
232 -
 233
233 -
 234
234 -
 235
235 -
 236
236 -
 237
237 -
 238
238 -
 239
239 -
 240
240 -
 241
241 -
 242
242 -
 243
243 -
 244
244 -
 245
245 -
 246
246 -
 247
247 -
 248
248 -
 249
249 -
 250
250 -
 251
251 -
 252
252 -
 253
253 -
 254
254 -
 255
255 -
 256
256 -
 257
257 -
 258
258 -
 259
259 -
 260
260 -
 261
261 -
 262
262 -
 263
263 -
 264
264 -
 265
265 -
 266
266 -
 267
267 -
 268
268 -
 269
269 -
 270
270 -
 271
271 -
 272
272 -
 273
273 -
 274
274 -
 275
275 -
 276
276 -
 277
277 -
 278
278 -
 279
279 -
 280
280 -
 281
281 -
 282
282 -
 283
283 -
 284
284 -
 285
285 -
 286
286 -
 287
287 -
 288
288 -
 289
289 -
 290
290 -
 291
291 -
 292
292 -
 293
293 -
 294
294 -
 295
295 -
 296
296 -
 297
297 -
 298
298 -
 299
299 -
 300
300 -
 301
301 -
 302
302 -
 303
303 -
 304
304 -
 305
305 -
 306
306 -
 307
307 -
 308
308 -
 309
309 -
 310
310 -
 311
311 -
 312
312 -
 313
313 -
 314
314 -
 315
315 -
 316
316 -
 317
317 -
 318
318 -
 319
319 -
 320
320 -
 321
321 -
 322
322 -
 323
323 -
 324
324 -
 325
325 -
 326
326 -
 327
327 -
 328
328 -
 329
329 -
 330
330 -
 331
331 -
 332
332 -
 333
333 -
 334
334 -
 335
335 -
 336
336 -
 337
337 -
 338
338 -
 339
339 -
 340
340 -
 341
341 -
 342
342 -
 343
343 -
 344
344 -
 345
345 -
 346
346
 |
 |

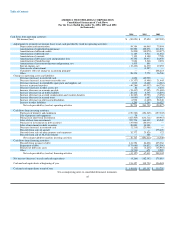
Table of Contents
AMERICA WEST HOLDINGS CORPORATION
Consolidated Statements of Cash Flows
For the Years Ended December 31, 2004, 2003 and 2002
(in thousands)
2004 2003 2002
Cash flows from operating activities:
Net income (loss) $ (89,023) $ 57,420 (387,909)
Adjustments to reconcile net income (loss) to net cash provided by (used in) operating activities:
Depreciation and amortization 54,354 66,865 75,894
Amortization of capitalized maintenance 85,590 105,076 111,576
Amortization of deferred credits (8,208) (10,970) (10,077)
Amortization of deferred rent 6,189 9,514 11,452
Amortization of warrants 7,155 8,100 7,708
Amortization of debt issue costs and guarantee fees 35,752 35,977 24,978
Amortization of bond discount 3,826 3,366 2,894
Amortization of investment discount and premium, net 1,435 899 —
Special charges, net (15,432) 14,370 19,055
Gain on sale of investment — (3,287) —
Cumulative effect of change in accounting principle — — 208,223
Other 28,374 7,770 16,746
Changes in operating assets and liabilities:
Decrease (increase) in restricted cash 1,636 (42,900) —
Decrease (increase) in accounts receivable, net (13,337) (5,408) 21,445
Decrease (increase) in expendable spare parts and supplies, net 1,012 (2,681) (4,061)
Increase in prepaid expenses (49,286) (45,932) (64,726)
Decrease (increase) in other assets, net 82 183 5,634
Increase (decrease) in accounts payable (35,417) 17,945 (71,488)
Increase (decrease) in air traffic liability 20,232 4,395 (6,894)
Increase (decrease) in accrued compensation and vacation benefits (18,347) 19,796 (3,050)
Increase (decrease) in accrued taxes (4,050) 1,687 (24,647)
Increase (decrease) in other accrued liabilities 6,938 (1,689) 28,348
Increase in other liabilities 1,299 1,294 16,022
Net cash provided by (used in) operating activities 20,774 241,790 (22,877)
Cash flows from investing activities:
Purchases of property and equipment (219,383) (154,365) (157,202)
Sale of property and equipment 74 — —
Purchases of short-term investments (487,505) (633,711) (69,987)
Sales of short-term investments 707,774 364,332 45,249
Purchases of investments in debt securities (35,000) (80,436) —
Sales of investments in debt securities 20,000 10,300 —
Decrease (increase) in restricted cash (2,215) (23,908) —
Proceeds from sales of aircraft — — 175,478
Proceeds from sales of other property and equipment 32,372 25,826 122
Proceeds from sale of NLG investment — 348 —
Net cash provided by (used in) investing activities 16,117 (491,614) (6,340)
Cash flows from financing activities:
Proceeds from issuance of debt 141,354 86,828 435,386
Repayment of debt (175,640) (16,832) (192,596)
Payment of debt issue costs (1,152) (3,236) (36,987)
Other (5,719) 671 2,299
Net cash provided by (used in) financing activities (41,157) 67,431 208,102
Net increase (decrease) in cash and cash equivalents (4,266) (182,393) 178,885
Cash and cash equivalents at beginning of year 153,357 335,750 156,865
Cash and cash equivalents at end of year $ 149,091 $ 153,357 $ 335,750
See accompanying notes to consolidated financial statements.
45
