US Airways 2004 Annual Report Download - page 54
Download and view the complete annual report
Please find page 54 of the 2004 US Airways annual report below. You can navigate through the pages in the report by either clicking on the pages listed below, or by using the keyword search tool below to find specific information within the annual report.-
 1
1 -
2
-
3
-
4
-
5
-
6
-
7
-
8
-
9
-
10
-
11
-
12
-
13
-
14
-
15
-
16
-
17
-
18
-
19
-
20
-
21
-
22
-
23
-
24
-
25
-
26
-
27
-
28
-
29
-
30
-
31
-
32
-
33
-
34
-
35
-
36
-
37
-
38
-
39
-
40
-
41
-
42
-
43
-
 44
44 -
 45
45 -
 46
46 -
 47
47 -
 48
48 -
 49
49 -
 50
50 -
 51
51 -
 52
52 -
 53
53 -
 54
54 -
 55
55 -
 56
56 -
 57
57 -
 58
58 -
 59
59 -
 60
60 -
 61
61 -
 62
62 -
 63
63 -
 64
64 -
65
-
66
-
67
-
68
-
69
-
70
-
71
-
72
-
73
-
74
-
75
-
76
-
77
-
78
-
79
-
80
-
81
-
82
-
83
-
84
-
85
-
86
-
87
-
88
-
89
-
90
-
91
-
92
-
93
-
94
-
95
-
96
-
97
-
98
-
99
-
100
-
101
-
102
-
103
-
104
-
105
-
106
-
107
-
108
-
109
-
110
-
111
-
112
-
113
-
114
-
115
-
116
-
117
-
118
-
119
-
120
-
121
-
122
-
123
-
124
-
125
-
126
-
127
-
128
-
129
-
130
-
131
-
132
-
133
-
134
-
135
-
136
-
137
-
138
-
139
-
140
-
141
-
142
-
143
-
144
-
145
-
146
-
147
-
148
-
149
-
150
-
151
-
152
-
153
-
154
-
155
-
156
-
157
-
158
-
159
-
160
-
161
-
162
-
163
-
164
-
165
-
166
-
167
-
168
-
169
-
170
-
171
-
172
-
173
-
174
-
175
-
176
-
177
-
178
-
179
-
180
-
181
-
182
-
183
-
184
-
185
-
186
-
187
-
188
-
189
-
190
-
191
-
192
-
193
-
194
-
195
-
196
-
197
-
198
-
199
-
200
-
201
-
202
-
203
-
204
-
205
-
206
-
207
-
208
-
209
-
210
-
211
-
212
-
213
-
214
-
215
-
216
-
217
-
218
-
219
-
220
-
221
-
222
-
223
-
224
-
225
-
226
-
227
-
228
-
229
-
230
-
231
-
232
-
233
-
234
-
235
-
236
-
237
-
238
-
239
-
240
-
241
-
242
-
243
-
244
-
245
-
246
-
247
-
248
-
249
-
250
-
251
-
252
-
253
-
254
-
255
-
256
-
257
-
258
-
259
-
260
-
261
-
262
-
263
-
264
-
265
-
266
-
267
-
268
-
269
-
270
-
271
-
272
-
273
-
274
-
275
-
276
-
277
-
278
-
279
-
280
-
281
-
282
-
283
-
284
-
285
-
286
-
287
-
288
-
289
-
290
-
291
-
292
-
293
-
294
-
295
-
296
-
297
-
298
-
299
-
300
-
301
-
302
-
303
-
304
-
305
-
306
-
307
-
308
-
309
-
310
-
311
-
312
-
313
-
314
-
315
-
316
-
317
-
318
-
319
-
320
-
321
-
322
-
323
-
324
-
325
-
326
-
327
-
328
-
329
-
330
-
331
-
332
-
333
-
334
-
335
-
336
-
337
-
338
-
339
-
340
-
341
-
342
-
343
-
344
-
345
-
346
 |
 |
Table of Contents
AMERICA WEST HOLDINGS CORPORATION
NOTES TO CONSOLIDATED FINANCIAL STATEMENTS — CONTINUED
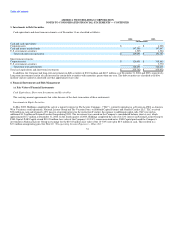
3. Investments in Debt Securities
Cash equivalents and short-term investments as of December 31 are classified as follows:
2004 2003
(in thousands)
Cash and cash equivalents:
Corporate notes $ — $ 4,206
Cash and money market funds 147,586 147,647
U.S. government securities 1,505 1,504
Total cash and cash equivalents $ 149,091 $ 153,357
Short-term investments:
Corporate notes $ 126,651 $ 318,845
U.S. government securities — 3,770
Total short-term investments 126,651 322,615
Total cash equivalents and short-term investments $ 275,742 $ 475,972
In addition, the Company had long-term investments in debt securities of $30.0 million and $40.7 million as of December 31, 2004 and 2003, respectively.
Long-term investments consist of cash invested in certain debt securities with maturities greater than one year. The debt securities are classified as held to
maturity and are carried at amortized cost that approximates fair value.
4. Financial Instruments and Risk Management
(a) Fair Value of Financial Instruments
Cash Equivalents, Short-term Investments and Receivables
The carrying amount approximates fair value because of the short-term nature of these instruments.
Investments in Equity Securities
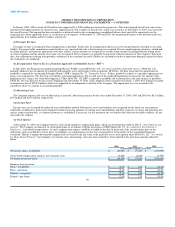
In May 2000, Holdings completed the sale of a majority interest in The Leisure Company, ("TLC"), currently operating as a division in AWA as America
West Vacations, retail operations, National Leisure Group and The Vacation Store, to Softbank Capital Partners and General Catalyst LLC. TLC received
$52 million in cash and retained a 12% passive ownership interest in the restructured venture. In response to additional capital calls, TLC invested an
additional $1.2 million in National Leisure Group during 2001. The investment was carried on the Company's consolidated balance sheet at cost, which
approximated $7.7 million at December 31, 2002. In the fourth quarter of 2003, Holdings completed the sale of its 12% interest in National Leisure Group to
PAR Capital. PAR Capital owned $10.45 million face value of the Company's 10 3/4% senior unsecured notes. PAR Capital purchased the Company's
investment in National Leisure Group in exchange for the $10.45 million face value of the 10 3/4% notes plus $0.3 million in cash. This resulted in a
$3.3 million nonoperating gain. See Note 12, "Nonoperating Income (Expenses) – Other, Net."
51